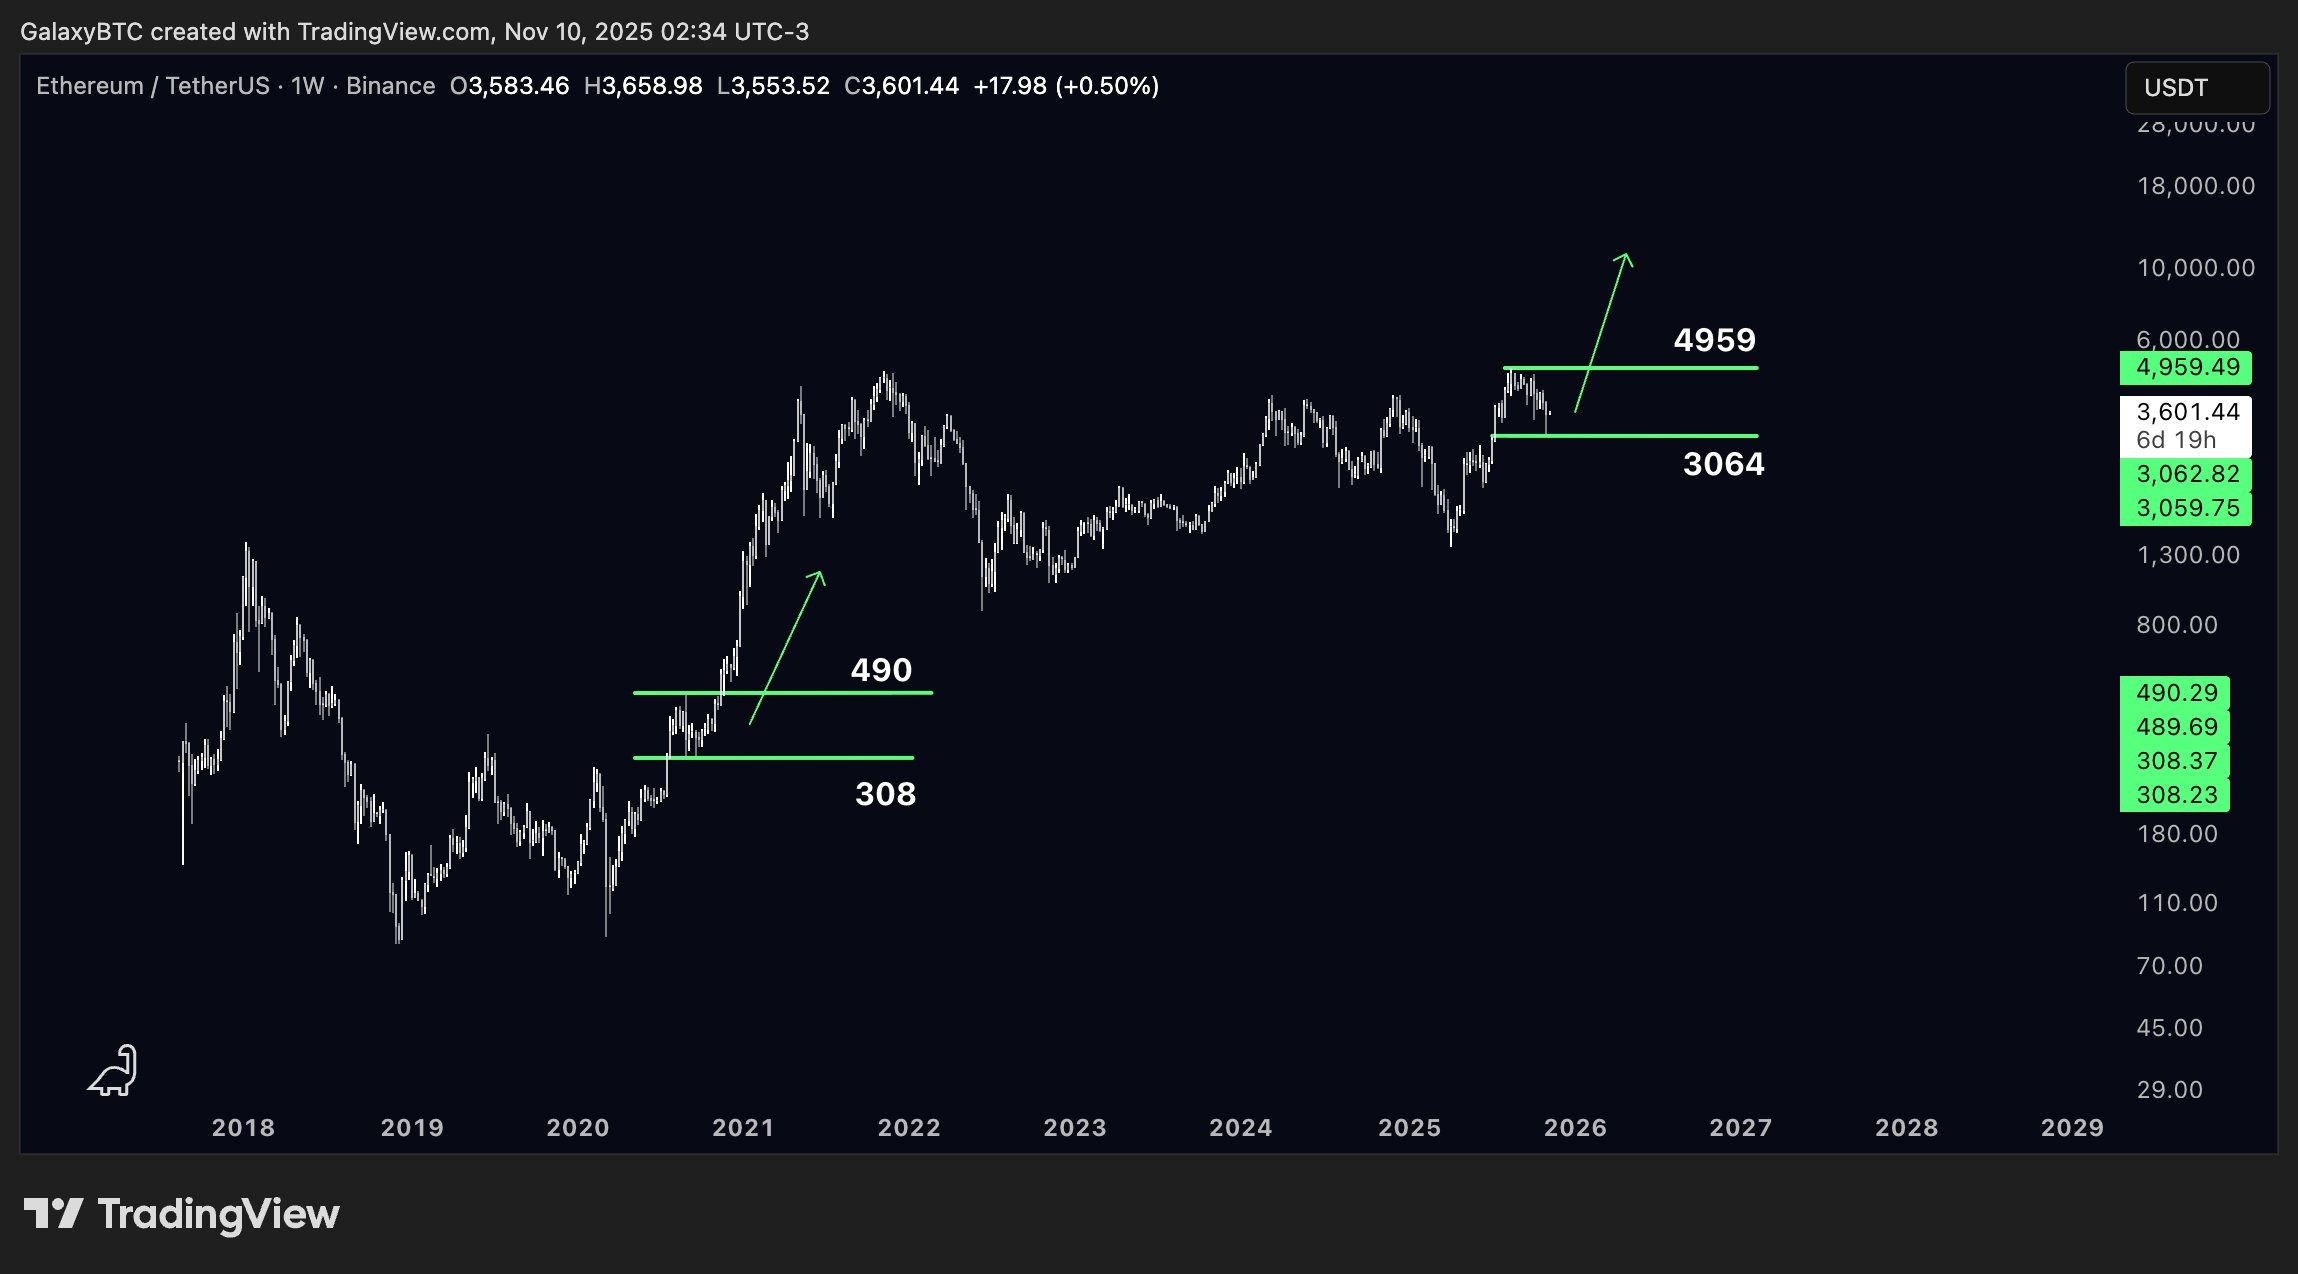
The extent of the current Ethereum price decline is reminiscent of the crash of 2020

- Ethereum fell from $4,960 to $3,490 – memories of the market crash of 2020 are brought back.
- A support between 3.000 and 3,500 dollars could serve as a basis for the rise again.
Ethereum (ETH) is showing patterns reminiscent of the 2020 market crash. Over the past three months, the ETH price has fallen from its ATH of $4,960 to a low near $3,000, reminiscent of 2020 when the price fell from $490 to $308.

Market watchers note the similarity in magnitude and structure, suggesting that the current pullback could be a healthy consolidation before a possible recovery.
Analyst Galaxy hob this parallel out and pointed out that the magnitude of both corrections and the subsequent recoveries have a strong similarity.

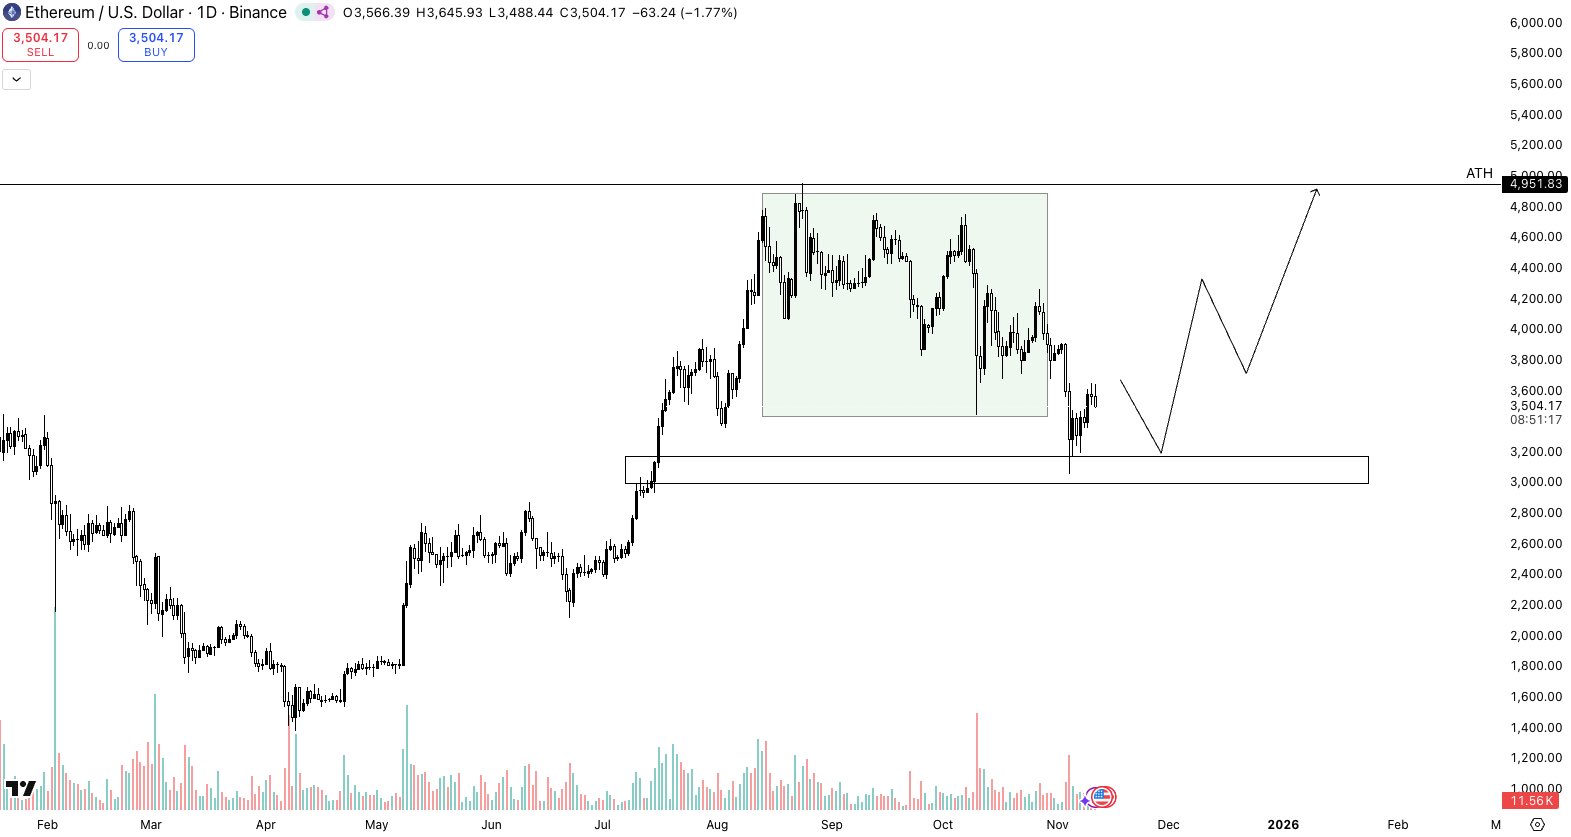
Currently, Ethereum is trading at $3,490.25, down about 3% weekly. Traders appear to be cautious as the asset hovers in this critical area.
Crypto Caesar merkte anthat the $3,500 zone acts as a defensive level for bulls, while $3,000 serves as an important psychological floor. In his opinion, if ETH maintains support above $3,000, a rebound towards $4,300 or higher remains possible.
ETH technical indicators signal short-term break
Technical analysis parameters suggest decreasing momentum, but not a break of support. On the weekly charts using the Ichimoku indicator, the Kijun-Sen is at around $3,473 and the Tenkan-Sen is slightly above at $3,538.
The resistance level within the Ichimoku Cloud at $3,470 is currently an area being contested by the bulls and bears.
If the price closes below this level later in the week, it could potentially test the $3,170 level or the psychological barrier at $3,000. A price above $3,723 or $3,907 would indicate that the uptrend remains strong.
Although there have been some recent declines, Ethereum has a cautiously positive outlook if key levels are held. Large investors actively trade at lower price levels.
PRIME
Whale activity points to new uptrend towards $4,800
Although there has been a recent decline, Ethereum still has a cautiously positive outlook in the long term if key supports are held. Large investors actively trade within the lower price ranges.
PRIME
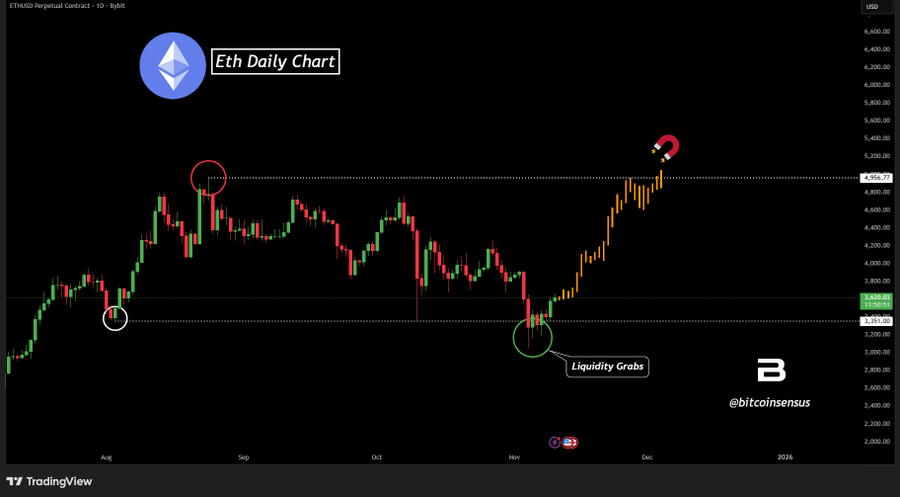
Bitconsensus notedthat there is a quick reversal from $3,350, likely due to liquidity design, and resistance is seen at $4,950.
Nevertheless, there was also some redistribution among the large holders. According to that Analyst Ali Martinez 23 of the largest ETH whales transferred or sold their holdings in the last week.
23 of the largest Ethereum $ETH whales have sold or redistributed their holdings in the past week! pic.twitter.com/On7UY8CzEO
— Ali (@ali_charts) November 10, 2025
If Ethereum can hold above $3,170 and momentum resumes, it could continue the uptrend. If not, it could turn the clock back a bit before the next big rise.


No Comments