Solana Price Dips Below $102 as Macro Risks Trigger Broad Crypto Sell-Off
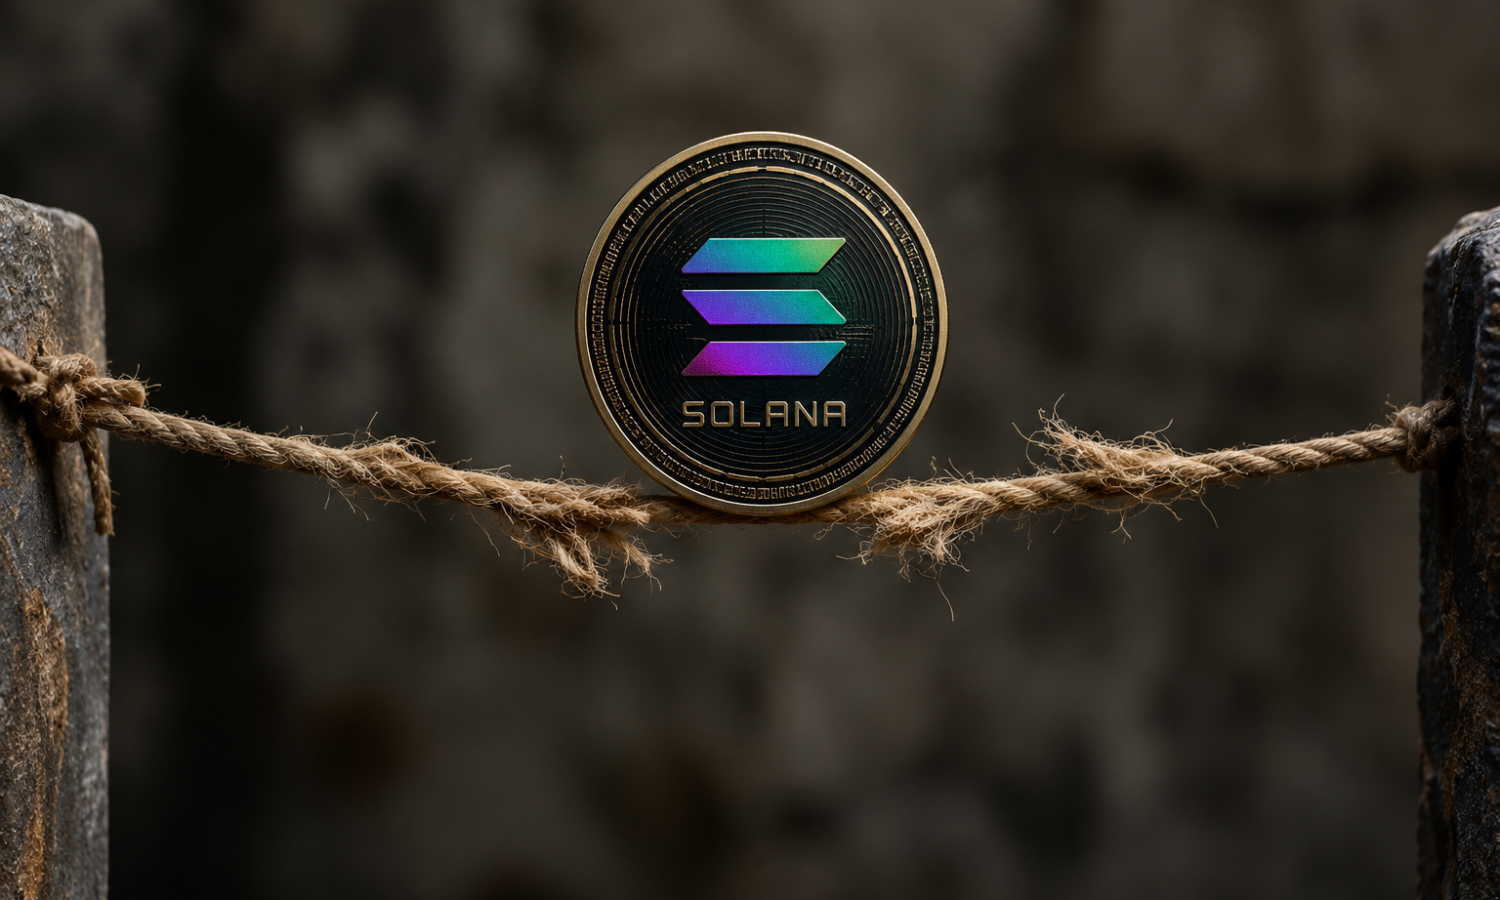
Solana (SOL) declined 3.5% over the past 24 hours to trade near $101 on September 10, putting the critical $100 support level under threat as selling pressure intensifies across digital asset markets. According to CoinGecko data at the time of writing, SOL was priced at $100.96 after retreating from the $104–$105 range and touching an intraday low of roughly $100.60.
Despite the near-term pullback, the token remains up 1.1% over the past seven days and has surged 34.5% over the last 30 days, climbing from the mid-$70s in August to briefly test the $110 level.
Macroeconomic Headwinds Drive Risk-Off Sentiment
The decline coincides with a broad risk-off move across global markets. Brent crude oil prices surged above $100 per barrel as the U.S.–Iran conflict escalated and attacks on shipping lanes disrupted energy flows through the Middle East. Higher energy costs have reignited concerns over U.S. inflation just ahead of key consumer price data and next week’s Federal Reserve policy decision.
Asian equities fell in tandem with cryptocurrencies as investors reduced exposure to risk assets. Additional pressure stemmed from the bond market, where the U.S. 10-year Treasury yield climbed to approximately 4.85%—its highest level since late 2023—after the Treasury announced a $6 billion long-dated bond buyback that was smaller than market participants had anticipated. Rising yields increase the opportunity cost of holding non-yielding assets like crypto at a time when markets are reassessing the trajectory of U.S. interest rates.
Traders are currently pricing in roughly a 60% probability of another Federal Reserve rate hike following strong labor market data. The macro-driven selloff swept across the crypto complex: Bitcoin hovered near $79,000, while roughly $246 million in leveraged positions were liquidated over the past 24 hours as volatility spiked.
No Solana-Specific Catalyst Behind the Drop
Coinbase market data linked SOL‘s decline to broad inflation concerns and weakness across smart contract platform tokens, supporting the view that the sell-off is not driven by a new Solana-specific event. Profit-taking likely amplified the move once SOL slipped from the $105 area.
Solana (SOL) Technical Price Analysis
Daily Chart: Momentum Fades, $100 Support in Focus
On the daily timeframe, SOL/USDT was trading near $101.19 after printing an intraday low of $100.50.
- Price has fallen below the 9-day simple moving average (SMA) at $102.88, leaving the short-term average above the market after supporting much of the August advance.
- The daily Commodity Channel Index (CCI) has dropped to -10.02 from over 300 during the August breakout. Its moving average remains elevated at 64.77.
- The CCI’s fall back through zero indicates the strong positive momentum behind the rally toward $110 has dissipated, though the indicator has not reached the -100 level typically associated with oversold conditions.
$100 now acts as immediate support after SOL repeatedly held the $100–$101 zone during the recent decline. A daily close below this level could bring $95 into focus, with the $90–$92.50 area forming the next major support zone stemming from the August breakout.
For a recovery to gain traction, SOL must first reclaim the 9-day SMA at $102.88. The next resistance cluster sits around $105–$107, where several recent upside attempts have stalled. A decisive break above that zone could put the August high near $110 back in play.
4-Hour Chart: Bearish Structure Intensifies
The 4-hour timeframe shows a similar deterioration in momentum.
- SOL has declined from the $106–$107 region since September 7 and was last trading at $101.18, with the latest candle reaching a low of $100.83.
- On-balance volume (OBV) has fallen to -44.94 million from roughly -41 million during the prior rebound, confirming that the move toward $100 has been accompanied by declining cumulative volume pressure.
- The 4-hour MACD line has dropped to -0.46, below the signal line at -0.33, with the histogram at -0.13. Both lines have moved below zero as SOL approaches $100, signaling short-term momentum favors sellers.
A break below $100 would expose the recent 4-hour support around $97.50–$98. SOL traded in that area during the early-September pullback before recovering toward $106. If $97.50 fails, the next visible support sits around $95.
For the bearish structure to weaken, SOL would need to recover to $102.50–$103 and push the MACD back toward its zero line. A move through $105 would then open the door to the $107 area, while the late-August peak near $110 remains the next major upside target.