Is South Korea the XRP crash trigger? These numbers make you sit up and take notice
- Upbit XRP/KRW has shown strong, partly automated net selling pressure for months and is often only weakly correlated to Binance.
- Intermittent “Reverse Kimchi Discount” indicates sellers’ KRW-driven liquidity needs. On “crash days” sales intensity increases sharply.
An analysis of order book and trade data from the South Korean exchange Upbit indicates ongoing, automated selling pressure in the XRP/KRW pair. Pseudonymous analyst “Dom” (X: @traderview2) argues that KRW-driven order flow can at times shape pricing more than many traders expect.
The influence of South Korea on the XRP price

Dom writeshe evaluated 82 million trades on Upbit (XRP/KRW) and, for comparison, 444 million trades on Binance. The trigger was a short-term movement the day before:
“It started with yesterday’s price action. -57 million XRP in CVD over 17 hours. That looked completely crazy. So I examined the trades in detail – including bot patterns, possible iceberg orders and signs of wash trading. The selling pressure was real. Algorithmic.”
According to Dom, the timing was particularly striking: 61% of the trades were triggered within 10 milliseconds. “A single bot traded continuously for 17 hours – with only one interruption of 33 seconds,” says Dom.
Dom describes the pattern as recurring. Upbit XRP/KRW is “net negative in every single month over 10 months”. Example months: April -165 million, July -197 million, October -382 million, January -370 million XRP (net). Overall, Dom puts net selling pressure at “3.3 billion XRP net. Around $5 billion.”
Over the period, only one week out of 46 was net positive. The comparison with Binance should also show that it is not just a global dynamic.
Dom writes, “Binance His core statement: “The hourly correlation between the two exchanges is only 0.37. The order flow on Upbit often behaves independently.”
Der „Reverse Kimchi Discount“
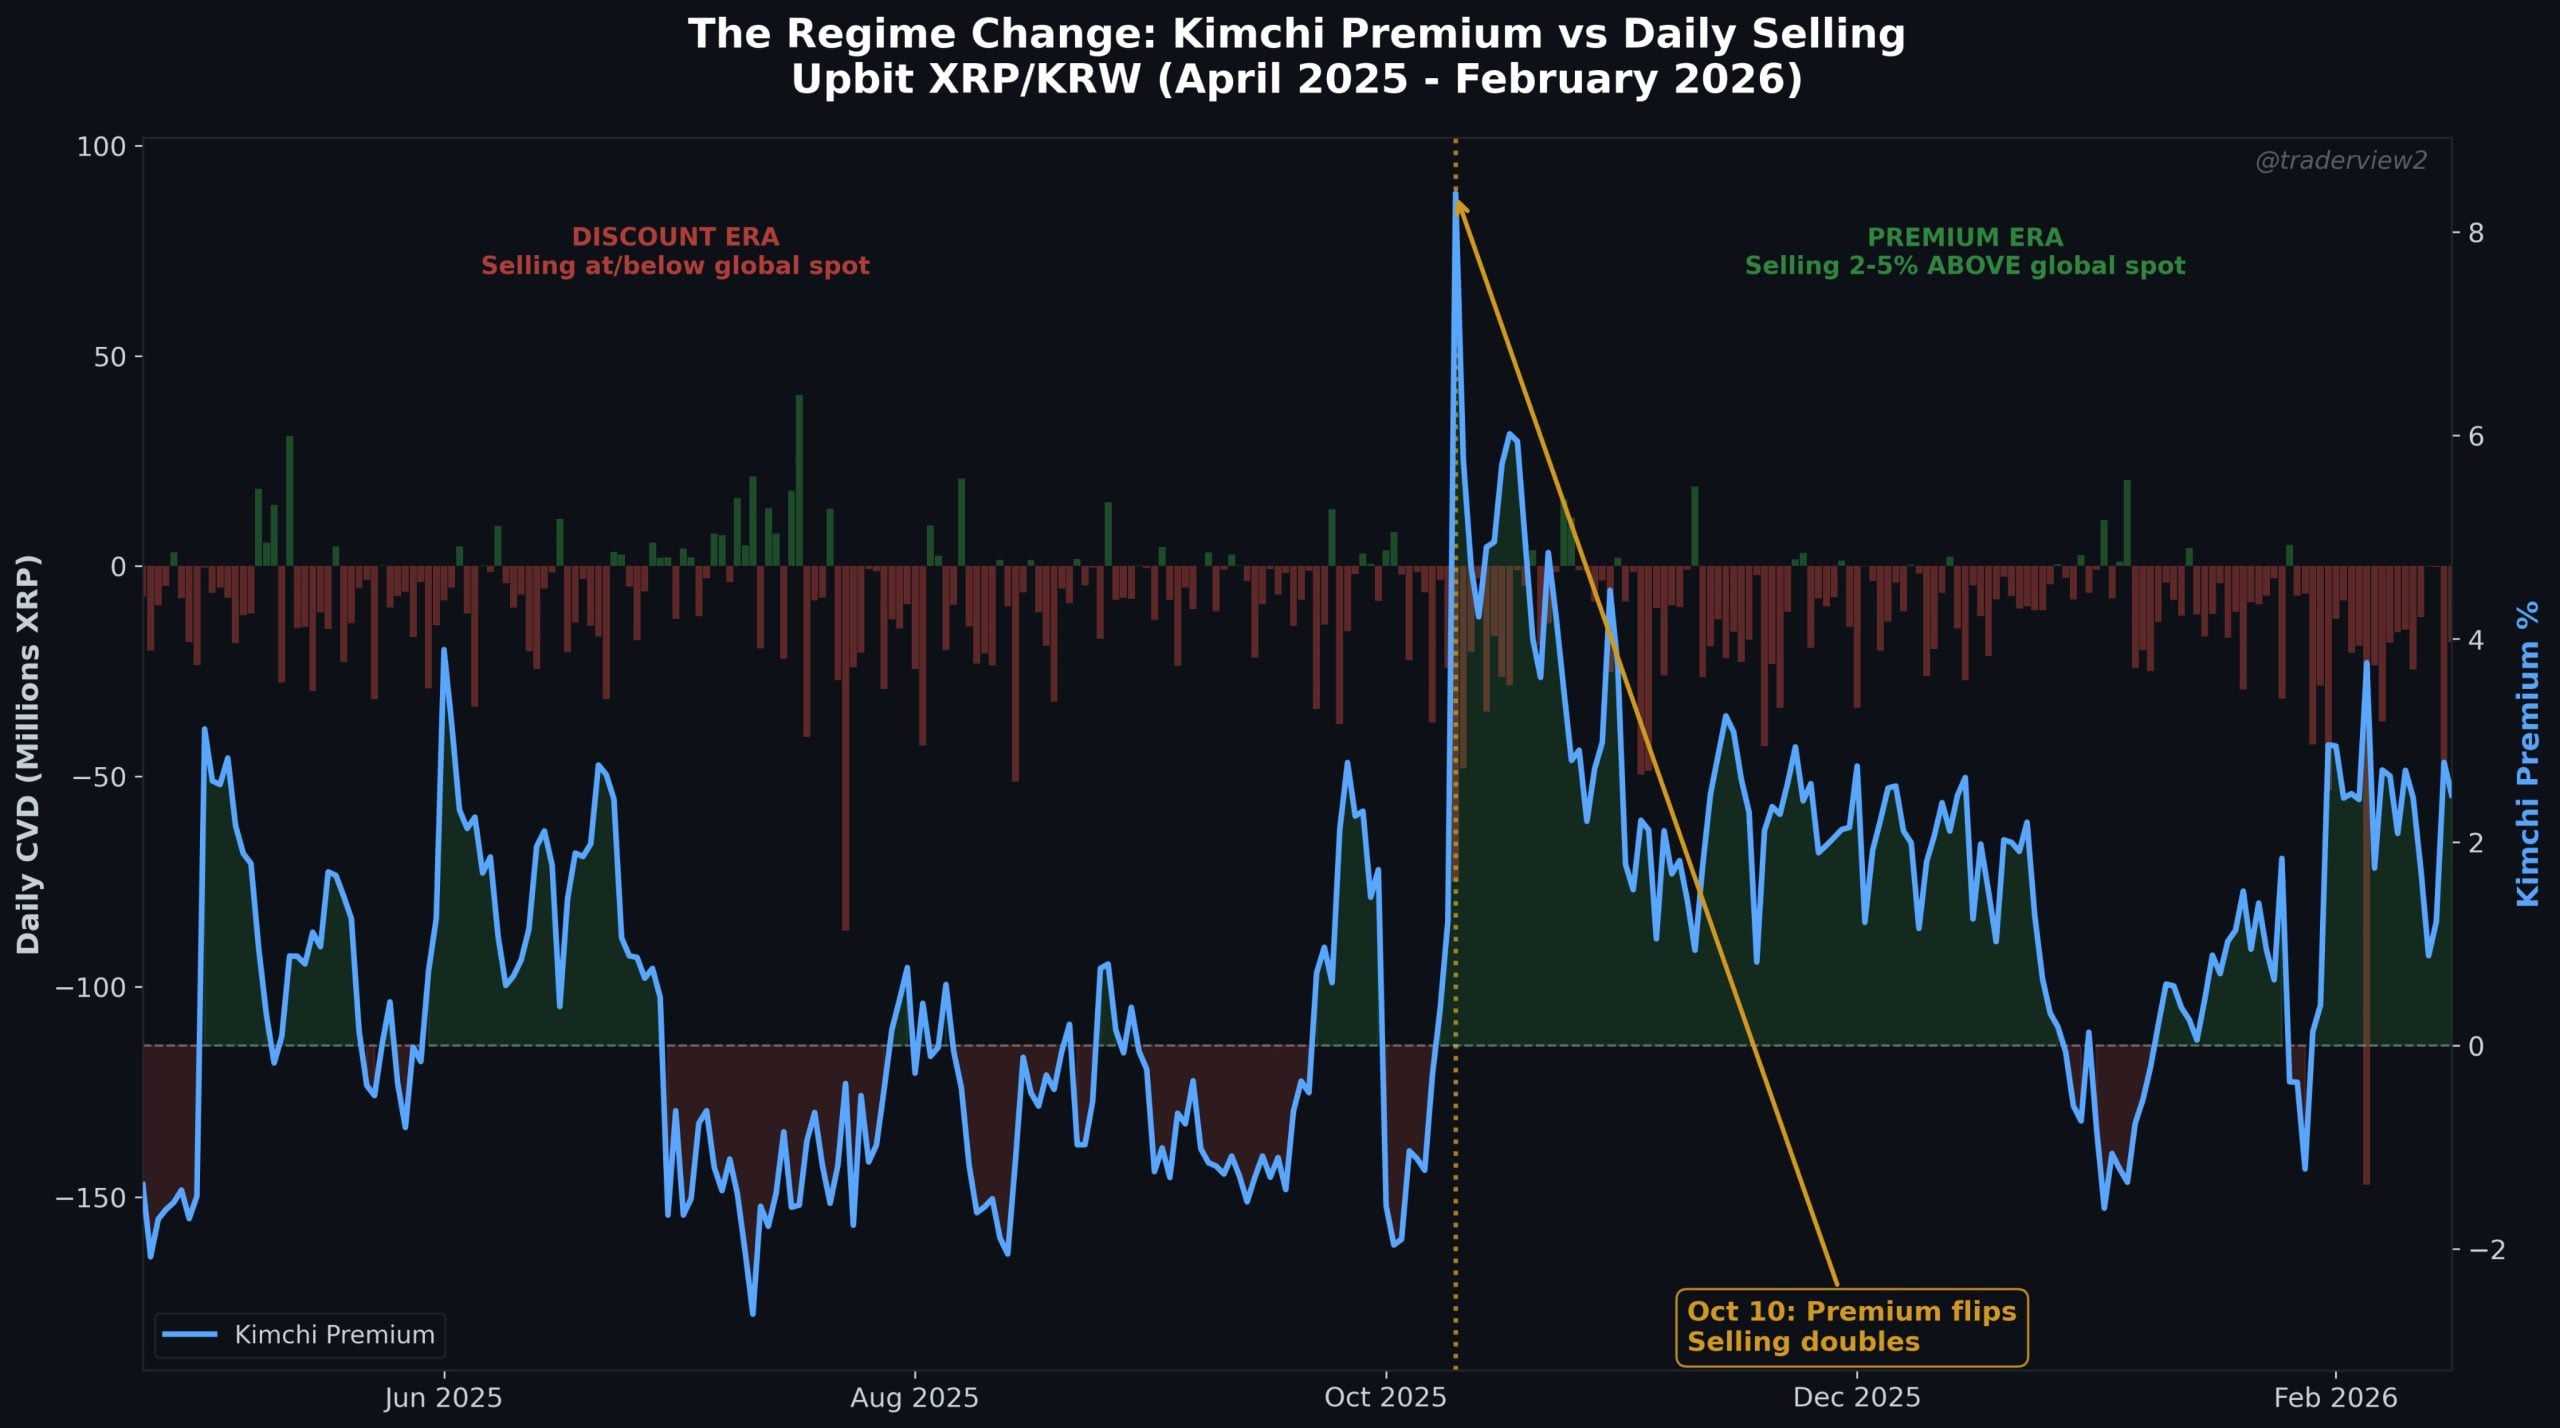
What is also noticeable is a phase in which XRP on Upbit was temporarily traded below the global price level: “From April to September, Upbit-XRP was traded 3 to 6% below Binance. A reverse kimchi discount.” Dom sees the discounts accepted over months as an indication that the sellers were primarily looking for KRW liquidity, not the best possible price. Dom writes:
“They don’t care about price. They need KRW, are obligated to use Upbit, and/or are Korean holders taking profits.”
On the day of the October 10th crash, the price structure shifted abruptly: “Korean private investors completely freaked out. The premium turned from -0.07% to +2.4% in a single day. Trades increased fivefold to 832,000.” At the same time, the sellers became more active: “And the sellers? They doubled their daily rate. From -6.3 million/day to -11.2 million/day.”
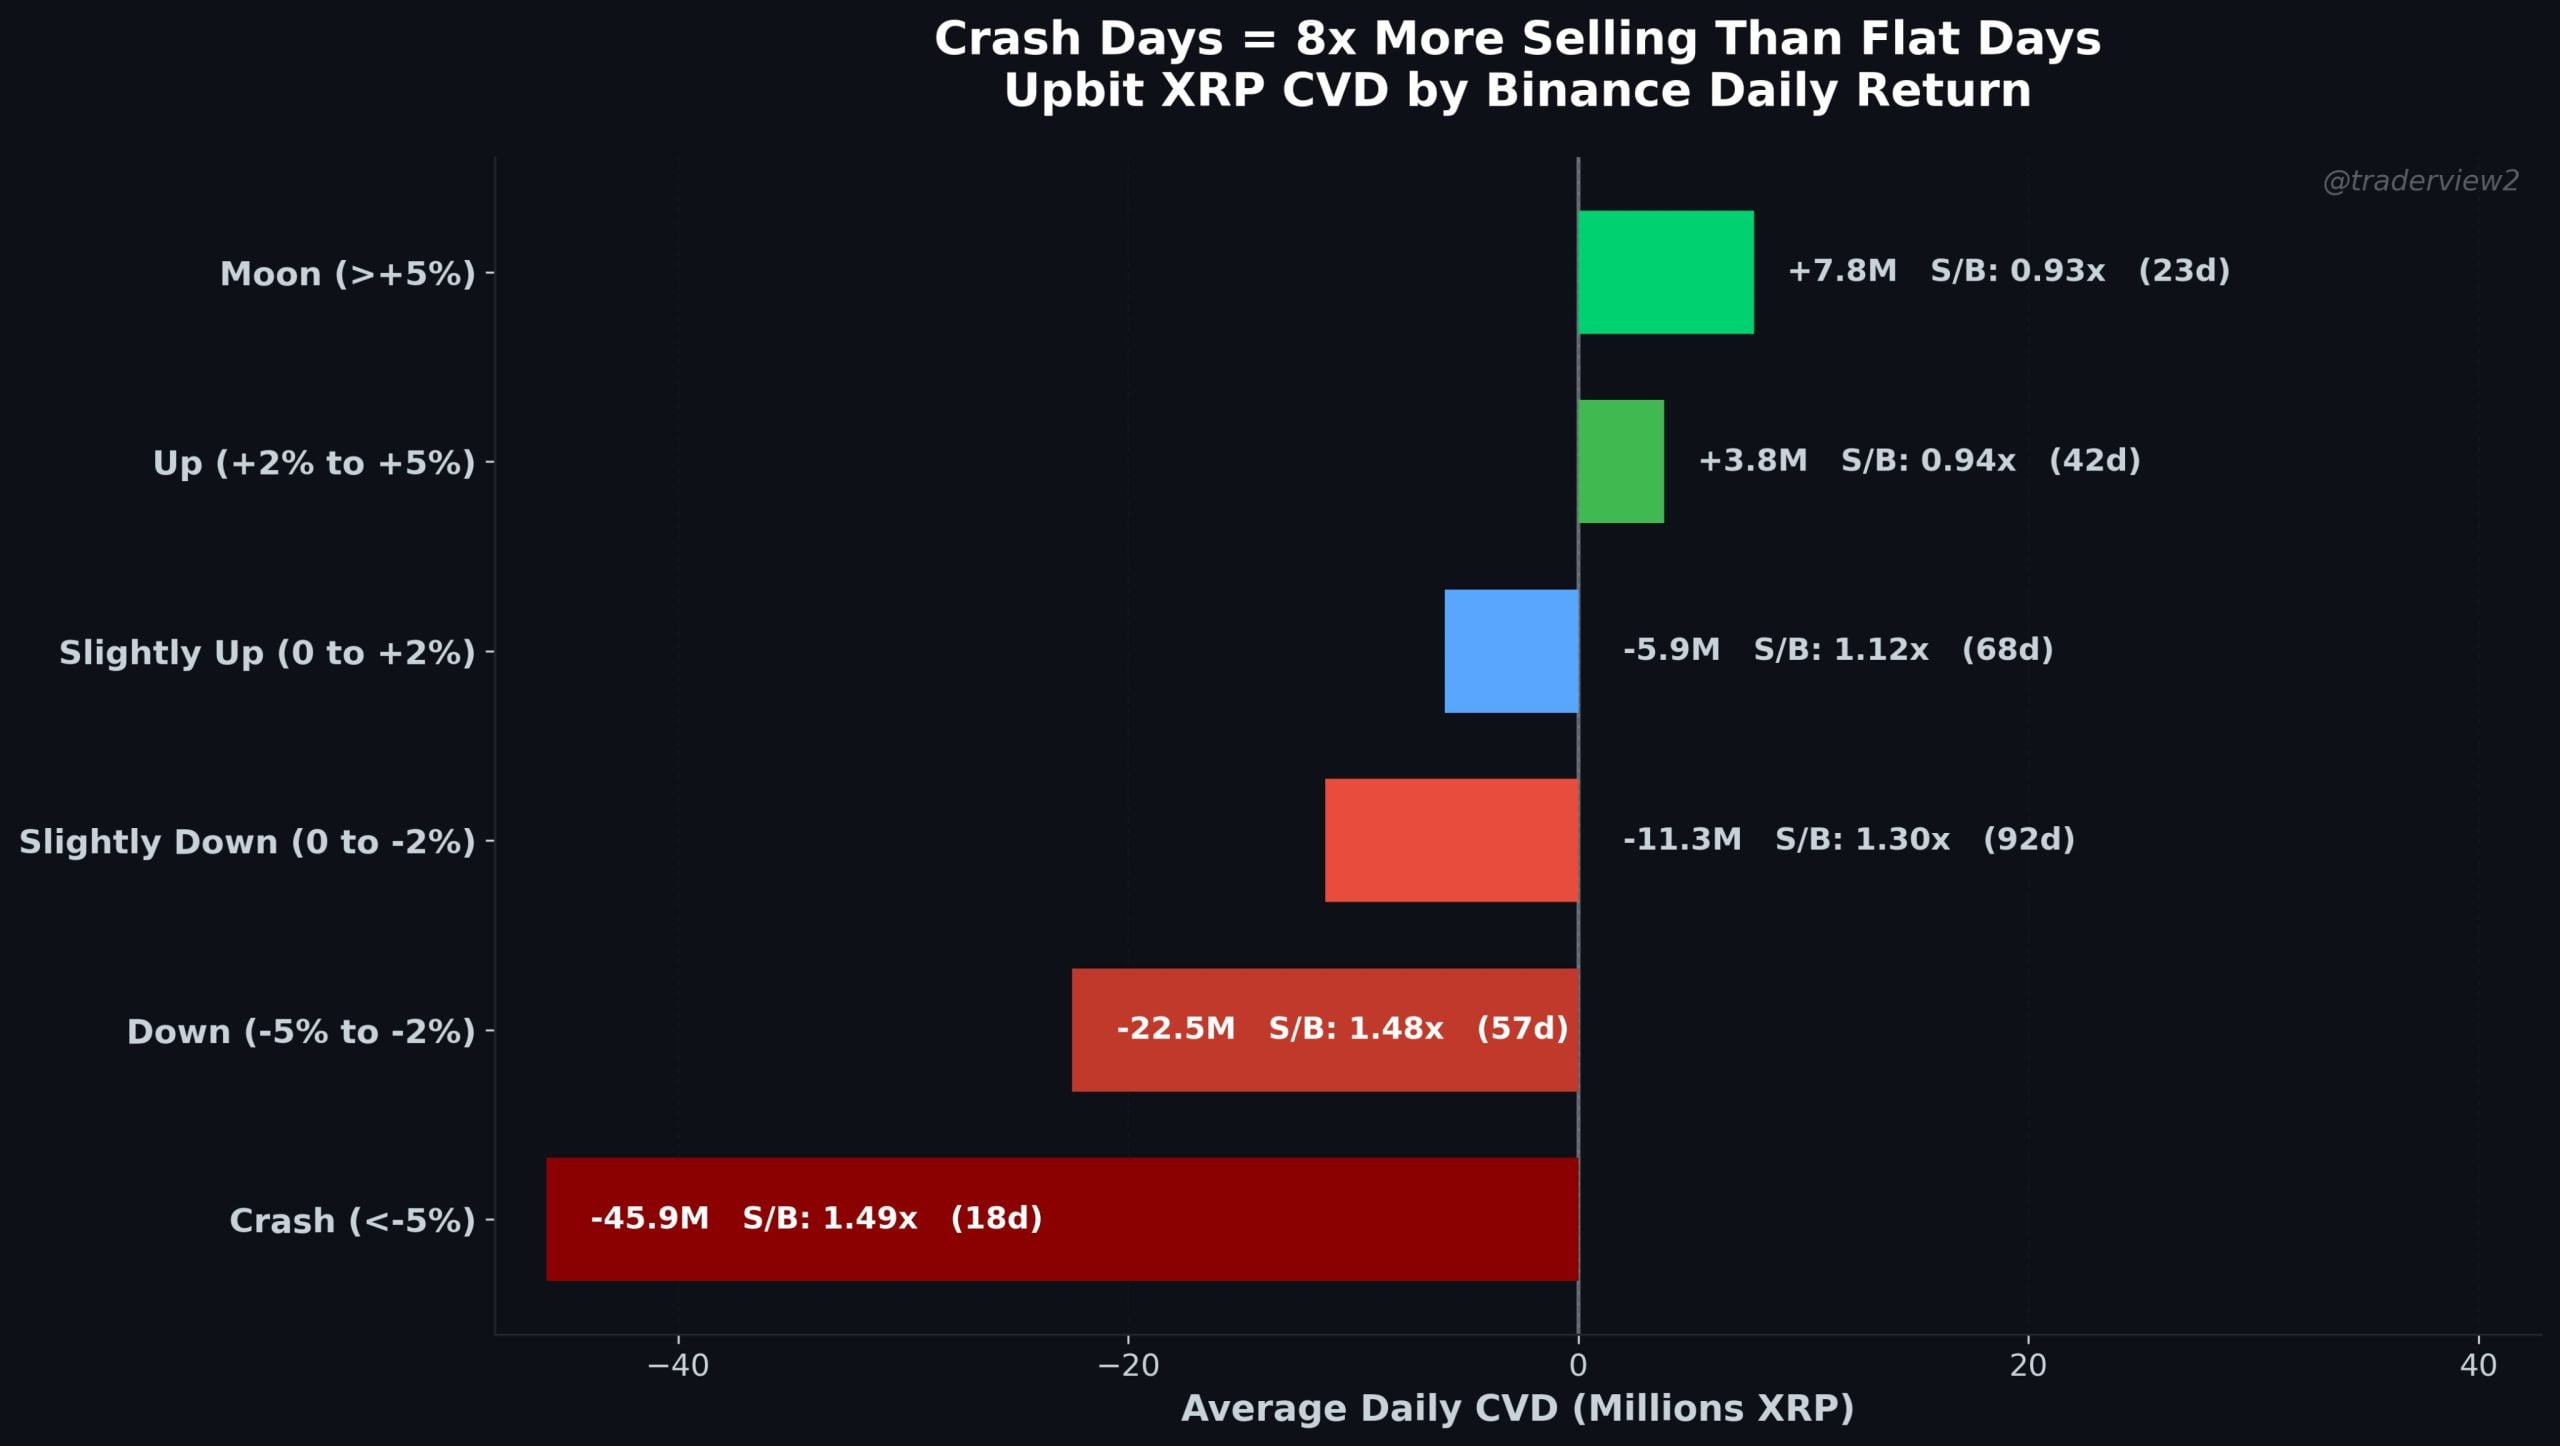
Dom also organizes Upbit flow data by global XRP days on Binance. On “crash days (< -5%)” he sees “-46M average CVD” and a ratio of “1.49x sell/buy”. On “Moon days (> 5%)”, however, “+8 million average CVD” at “0.93x sale/purchase”. For Dom, this suggests pro-cyclical behavior:
“Read that again. On moon days, Korean retail investors become net buyers. They accumulate. On crash days, selling intensity is eight times higher.”
The trade sizes are also asymmetrical: “28% of buy trades are tiny fractional sizes […] that matches KRW-denominated orders,” while the sell side “round numbers […] 10, 100, 1000 XRP” show.
“One side looks like retail. The other looks like a machine.”
What does this mean for XRP?
Dom puts the magnitude into perspective: “3.3 billion XRP represents 5.4% of the total circulating supply of XRP” – net over “a single trading pair on a single exchange in 10 months.”
Dom leaves it open whether Korean retail owners are primarily behind the behavior or a specific institution linked to KRW. However, its data suggests that Upbit’s XRP/KRW flow can at times have a significant impact on short-term price movements. Monitoring Korean stock market data may therefore be more relevant for traders than is often assumed.


No Comments