
- Bitcoin reclaimed $92,000 and rose to $93,388.
- The main reason for the price rally is short liquidations and the geopolitical escalation in Venezuela.
Bitcoin reclaimed the $92,000 mark again over the weekend. After BTC hit a low of $88,379 on Friday, the price rose to an intraday high of $93,388 on Monday.

The trigger for the price rally of around $5,000 (+5.7%) appears to be the geopolitical escalation surrounding Venezuela, which has indirectly boosted the Bitcoin price through energy prices and inflation narratives.
Why has the Bitcoin price risen?

In addition, The Kobeissi Letter (@KobeissiLetter) the movement explicitly with short liquidations:
“Bitcoin shoots toward $93,000 after liquidating $75 million worth of leveraged shorts in 60 minutes. Bitcoin is now nearly $5,000 above its Friday night low after the US began attacks on Venezuela.”
However, the impact on energy prices plays the most important role. The Kobeissi Letter reported that natural gas futures fell 6% at one point shortly after reopening on Sunday evening and oil was back below $57 a barrel, near its lowest levels since 2021.
This is atypical in that energy prices “typically” move upwards during escalations with oil-producing countries. The difference this time, according to Kobeissi, is that greater US control of Venezuela could in the future bring “more oil and gas supply” onto the market; Accordingly, the market is not pricing in scarcity, but rather potentially additional supply.
“The market knows that this weekend’s events will ultimately lead to the opposite of a supply disruption,” Kobeissi wrote, adding: “The market is never wrong.”
This could have a positive impact on the inflation debate in the USA: more expected supply could depress energy prices, ease the inflation picture and thus provide tailwind for risk assets.
Order flow: Futures led, spot bought with them
Mechanically, the move was described in the material as a combination of fresh Bitcoin longs, short flush and moderate spot buying. YouTuber Furkan Yildirim wrote that the futures CVD slope was “clearly upward” and “accelerated significantly toward the breakout,” with derivatives leading the push. At the same time, the spot CVD is also pointing upwards, “slightly flatter than futures”: there is “real buying from the spot market,” but not as a dominant driver.
Seine assessment reads:
“The rise is driven by both sides (spot + derivatives), with futures leading. This speaks for short-term strength, but is vulnerable if OI continues to run higher and funding gets hot again. It will be more sustainable if spot CVD continues to rise and OI stabilizes after the jump instead of continuing to increase aggressively.”
What are the next price targets?
In the 4-hour chart, Daan Crypto Trades (@DaanCrypto) points out that Bitcoin is back above the 200 moving averages. “BTC has broken above its 4H 200MA/EMA. This usually gives a good indication of short- to medium-term momentum,” he wrote, but cautioned that the start of the year and month tends to be “a bit rough.”
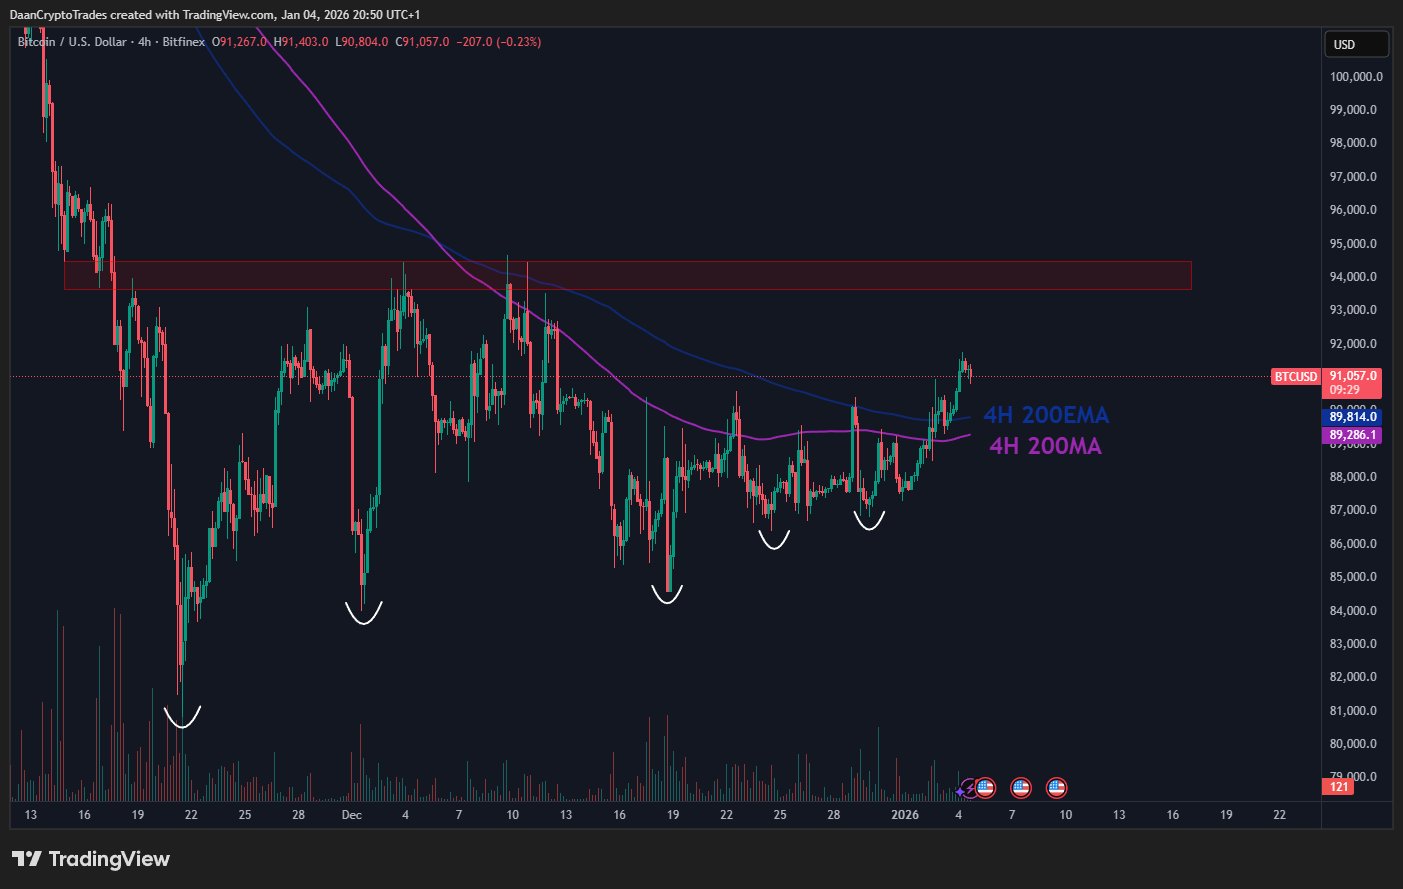
For him, the central level remains “the horizontal area around $94,000” as a range high. In the screenshot, the 4H-200EMA is at $89,814 and the 4H-200MA is at $89,286. The break above shows the current momentum in the market, but does not replace the break of the central resistance at $94,000.
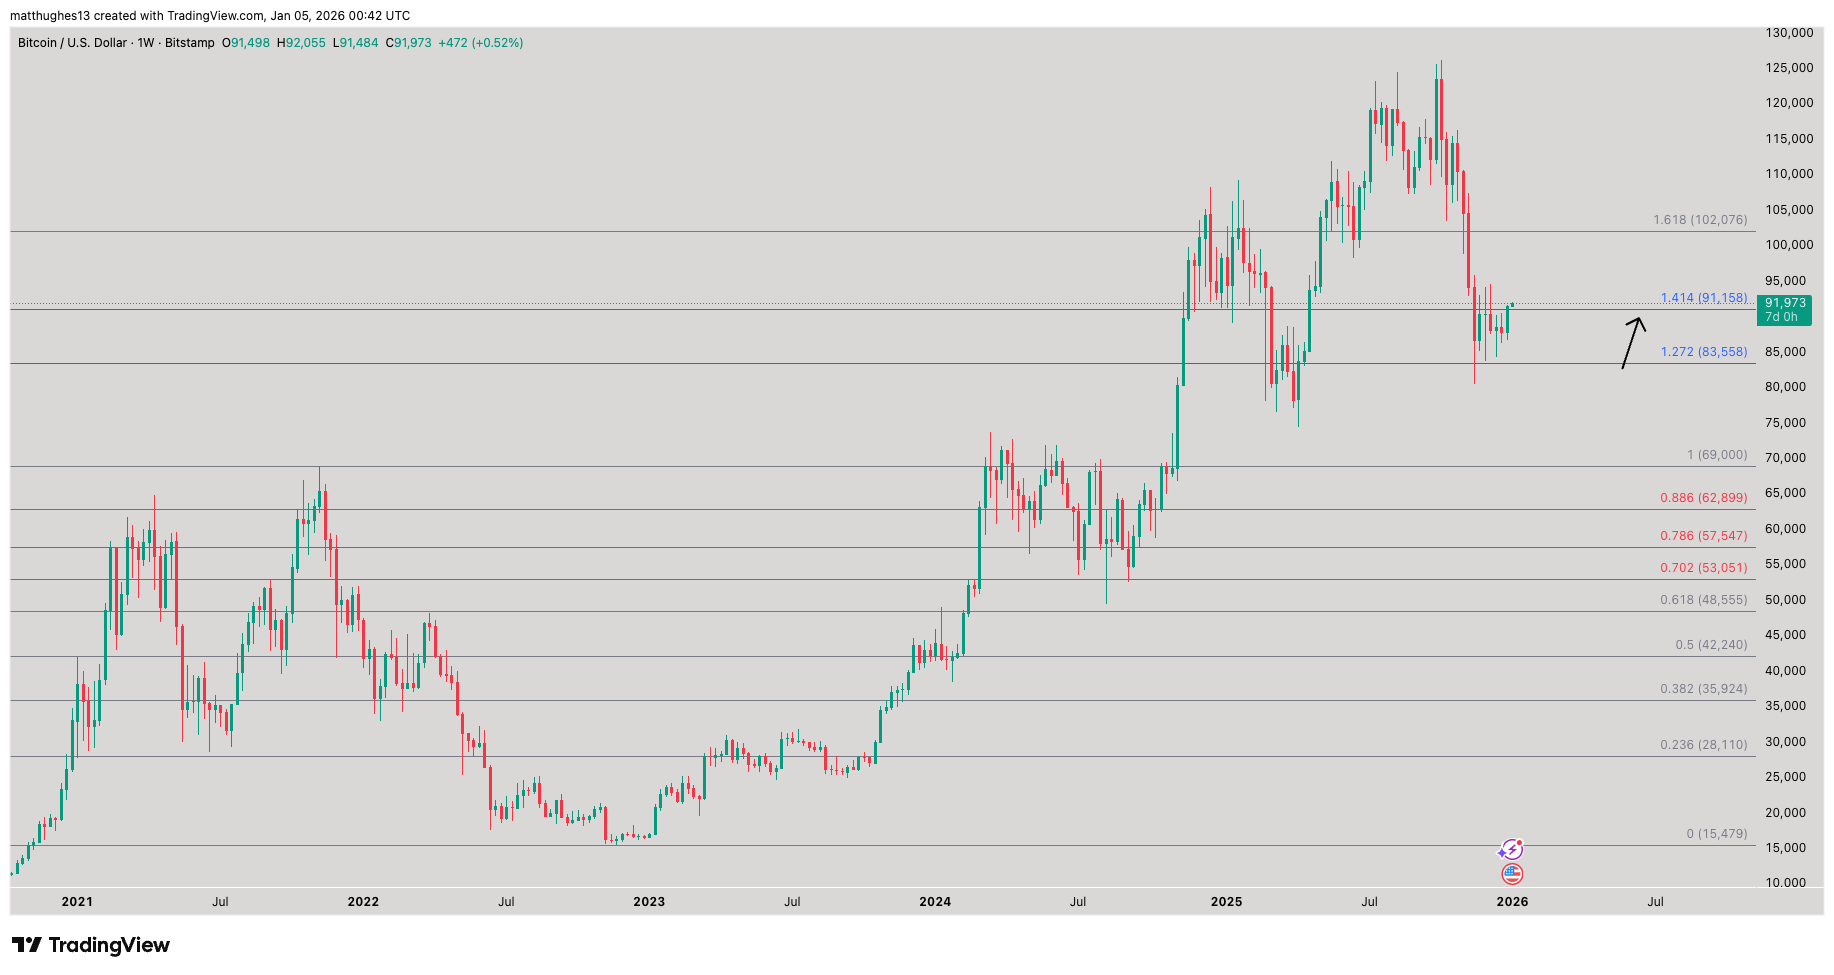
On the weekly chart, Matt Hughes aka “The Great Mattsby” sets a specific weekly close as a goal. “Does this weekly candle close above 91,158 make bears nervous? It’s the first weekly close above this 1.414 fib since it broke below in November,” he wrote. The next designated level on its chart is at the 1.618 Fib at $102,076.
Dutch crypto trader Michaël van de Poppe describes the 12-hour chart as follows: “Here we are! Last hurdle before $100,000: This is where Bitcoin currently stands. I wouldn’t expect a clear, immediate breakout; but I expect it to happen in the coming week. The year started off bullish.”
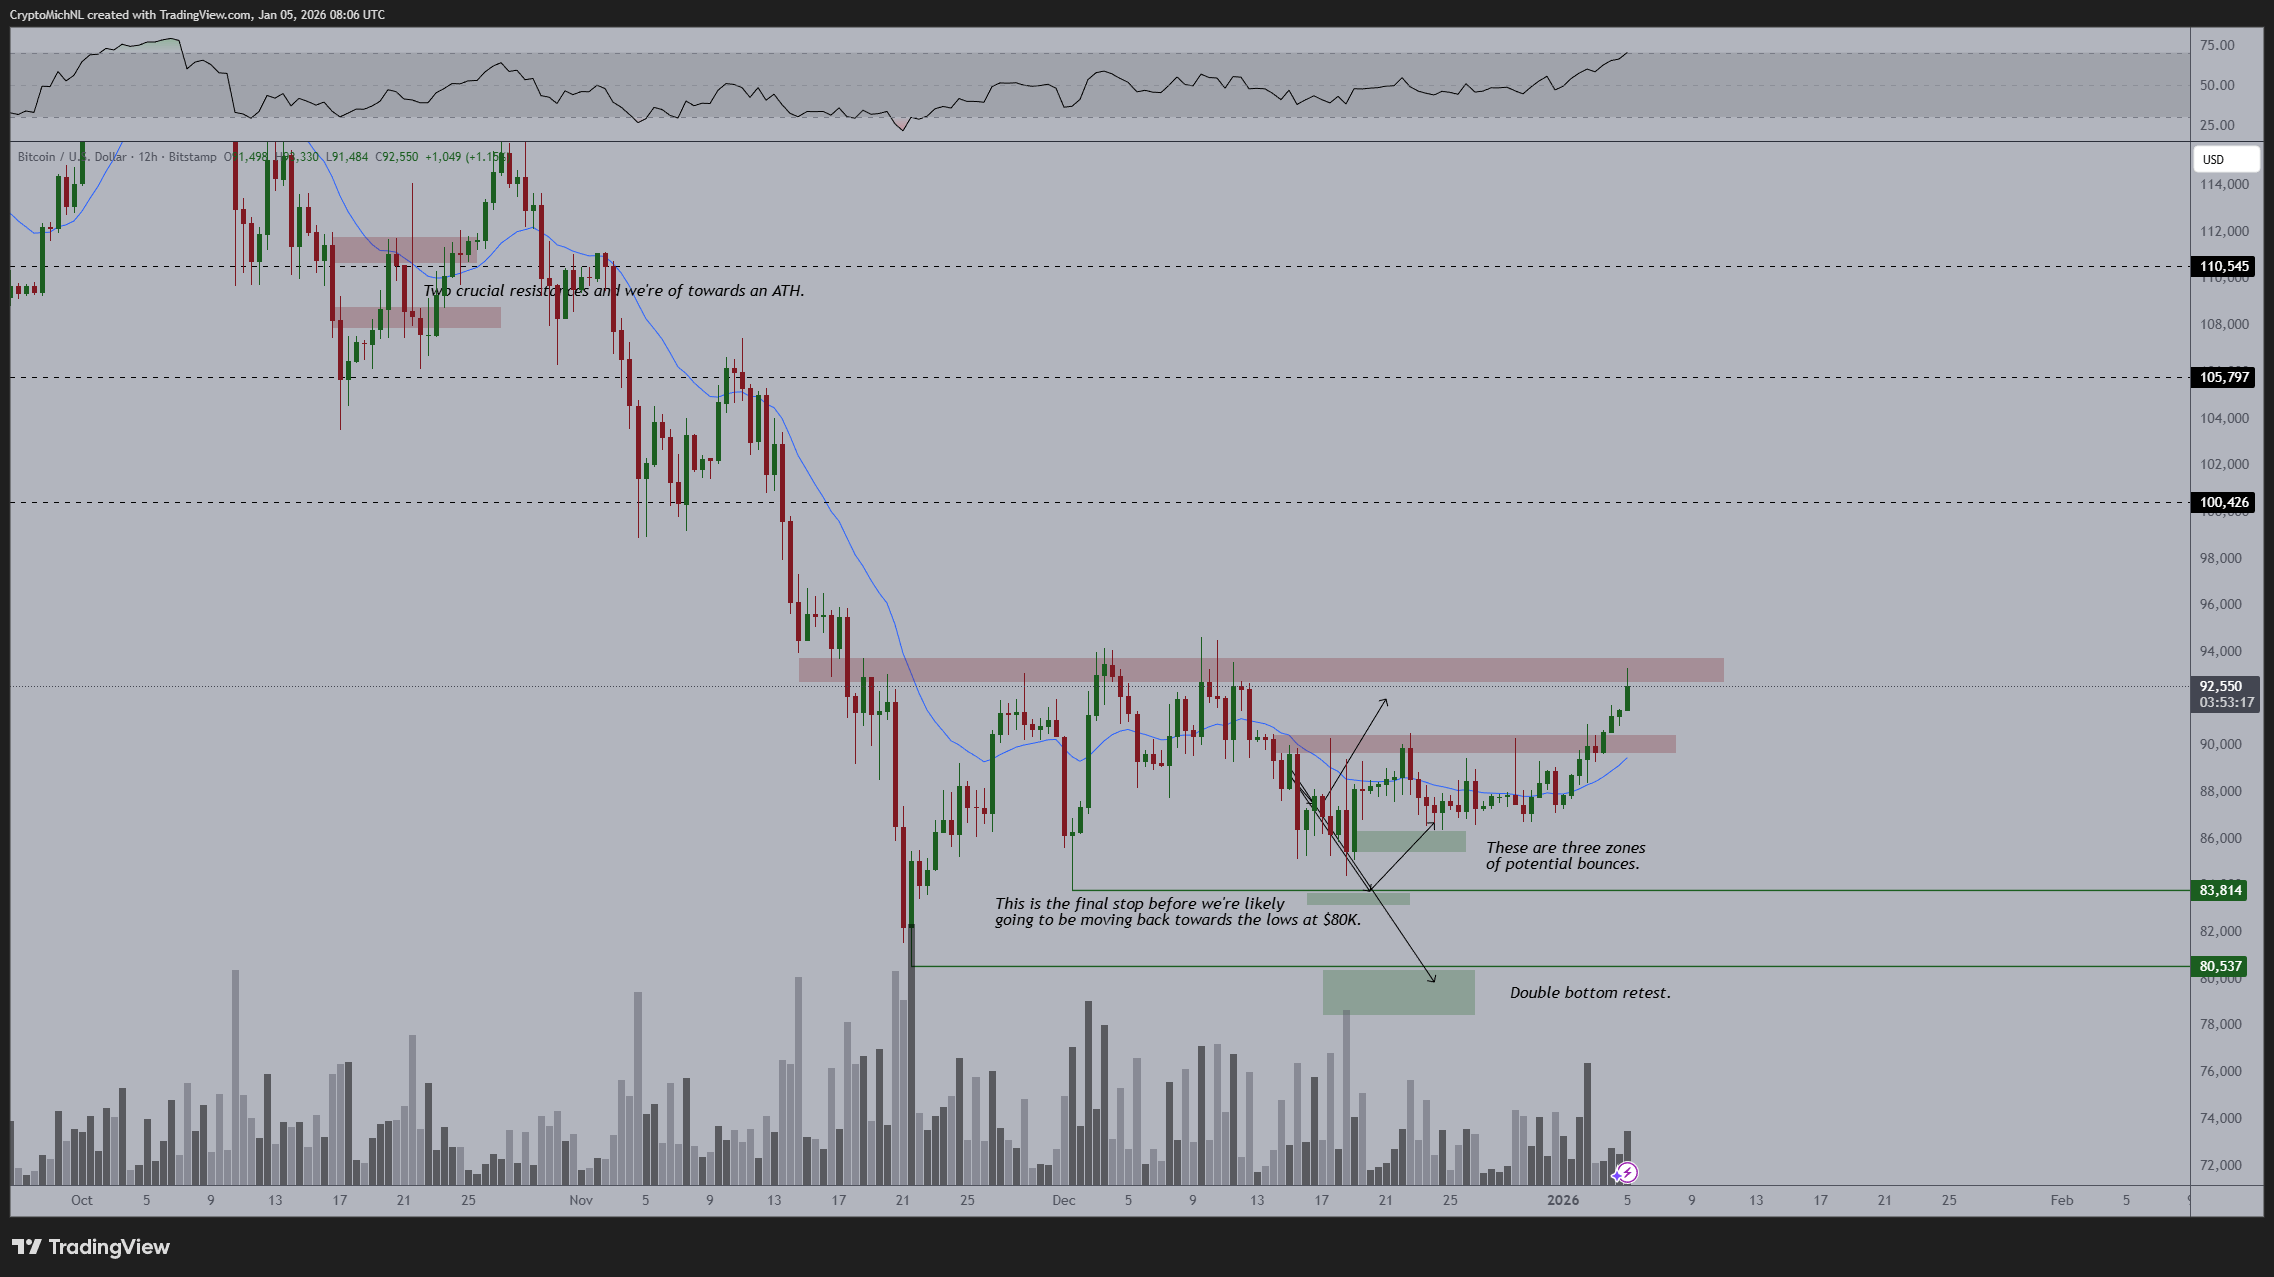
Its chart also marks the zone between $93,000 and $94,000 as crucial resistance. If BTC can overcome this hurdle, $100,426 would be the next logical step, according to van de Poppe. Furthermore, it marks $105,797 and $110,545 as follow-on targets.


No Comments