Bitcoin price analysis at the end of the year: What becomes important now

- Bitcoin continues to trade between $84,000 and $95,000: low volatility, technical holding mode.
- BTC/Gold looks oversold while on-chain data remains mixed.
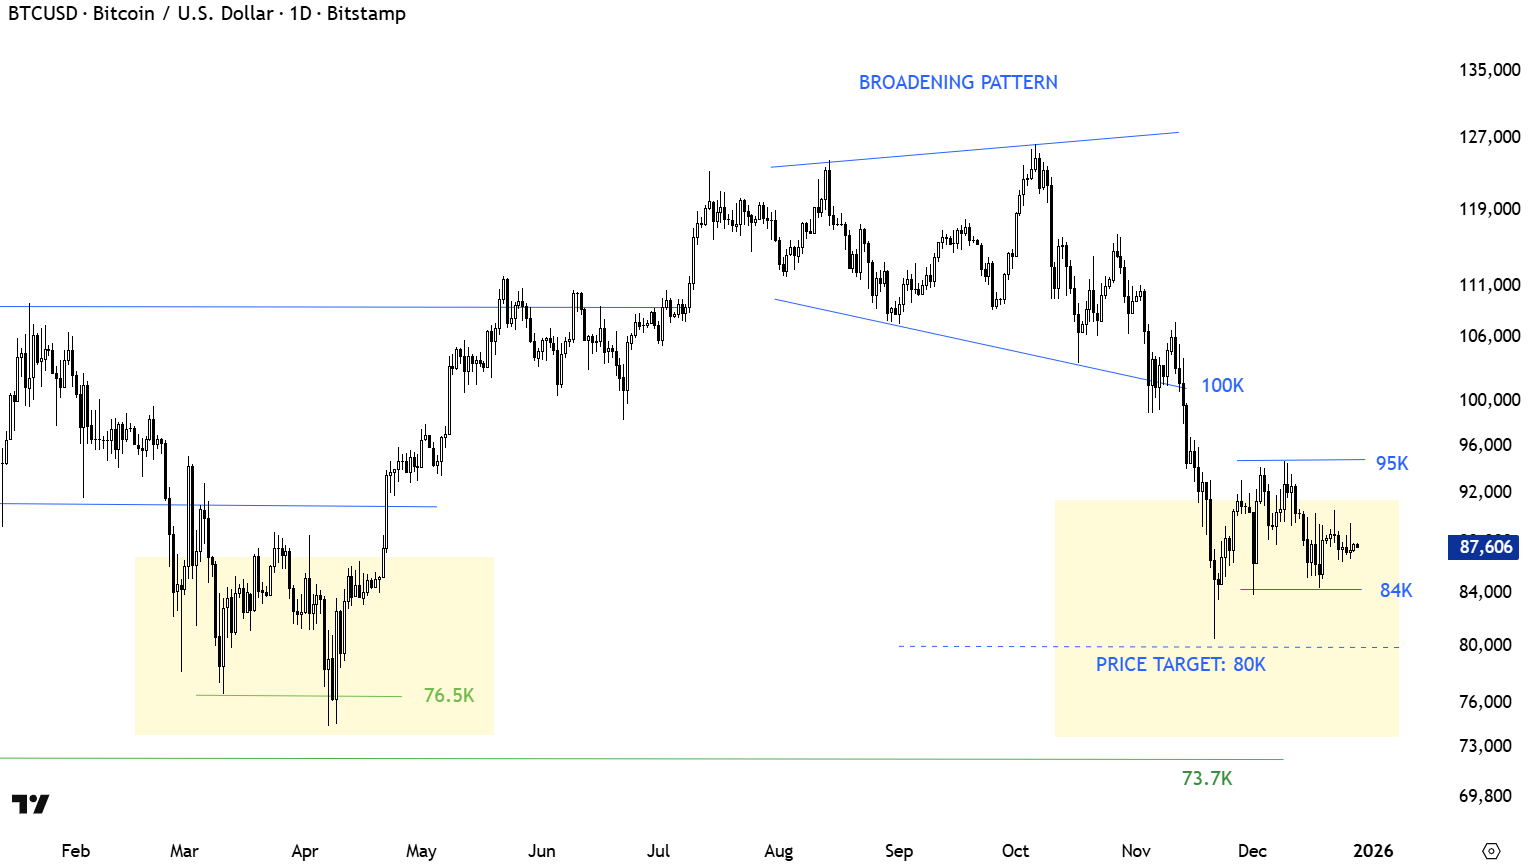
At the end of the year, Bitcoin continues to move in a technically delicate area, with the price in the last few days more like a stablecoin. Since November 23rd, the BTC price has been stuck in the zone between $84,000 and $95,000.

According to Chartered Market Technician (CMT) and former fund manager Aksel Kibar, after an extremely volatile top phase (“broadening pattern”) followed by a sharp sell-off, Bitcoin has now slipped into a phase of low volatility. The price is currently stabilizing in a range between $84,000 and $95,000.
“We are in the middle of the process. Volatility runs in cycles. High volatility is now followed by a phase of low volatility – until we find a clean chart pattern that can be traded in a targeted manner,” writes the renowned chart analyst via X.
Bitcoin/Gold: Oversold like never before

At the same time, some market observers are focusing on the relative valuation compared to gold. YouTuber Furkan Yildirim posted a BTC/Gold chart with the note: “Bitcoin has never been as oversold relative to gold as it is currently. Interestingly, the lows were formed at exactly these points in time and Bitcoin was then able to march upwards. Is history repeating itself or is everything different this time, what do you think?”
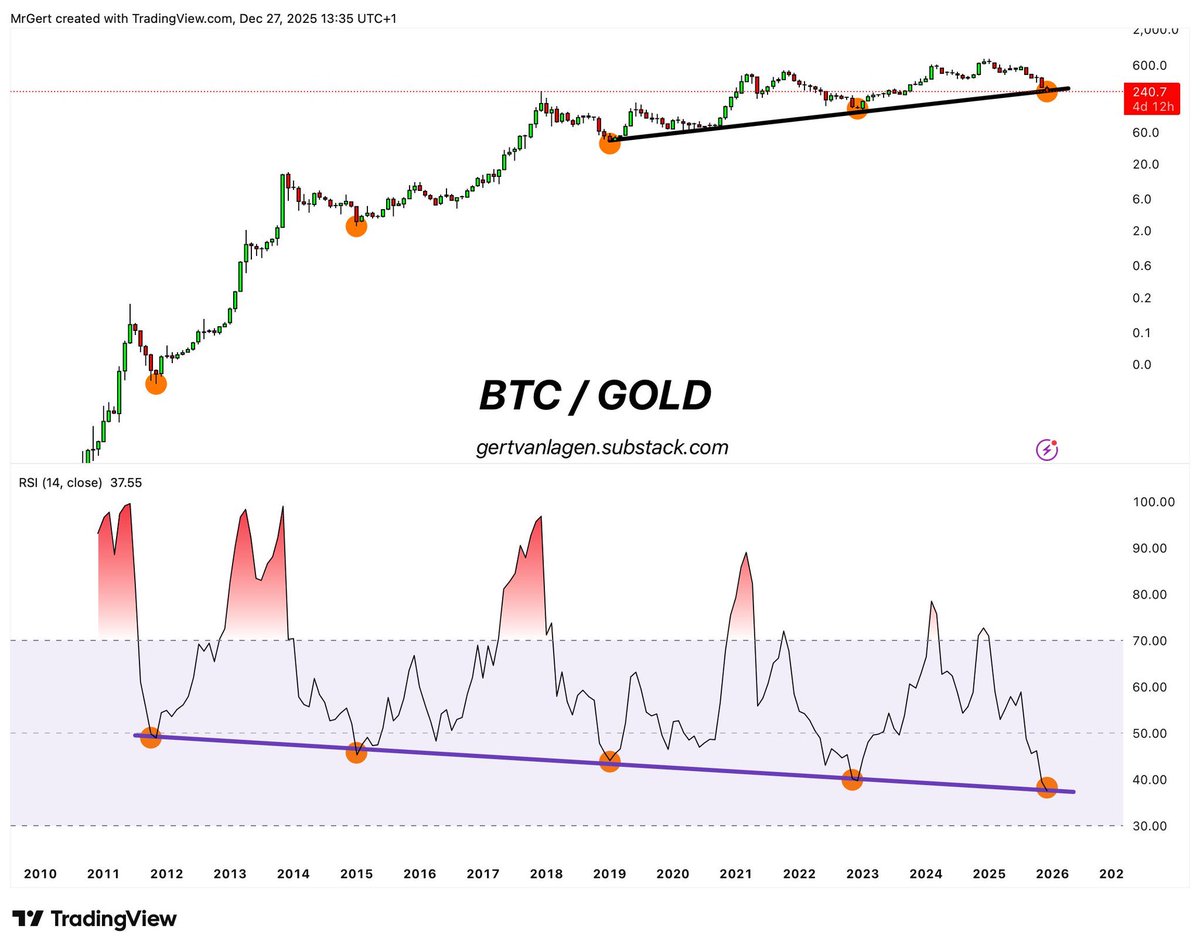
Chart analyst Christopher Inks (@TXWestCapital) sees it similarly. While other analysts are panicking that Bitcoin could fall lower, Inks is projecting a bullish chart pattern. “I have seen several BTC/Gold line charts that virtually guarantee you further Bitcoin downward pressure. […] It is possible that an ascending triangle has formed and the price is heading straight back to the ascending support line.”
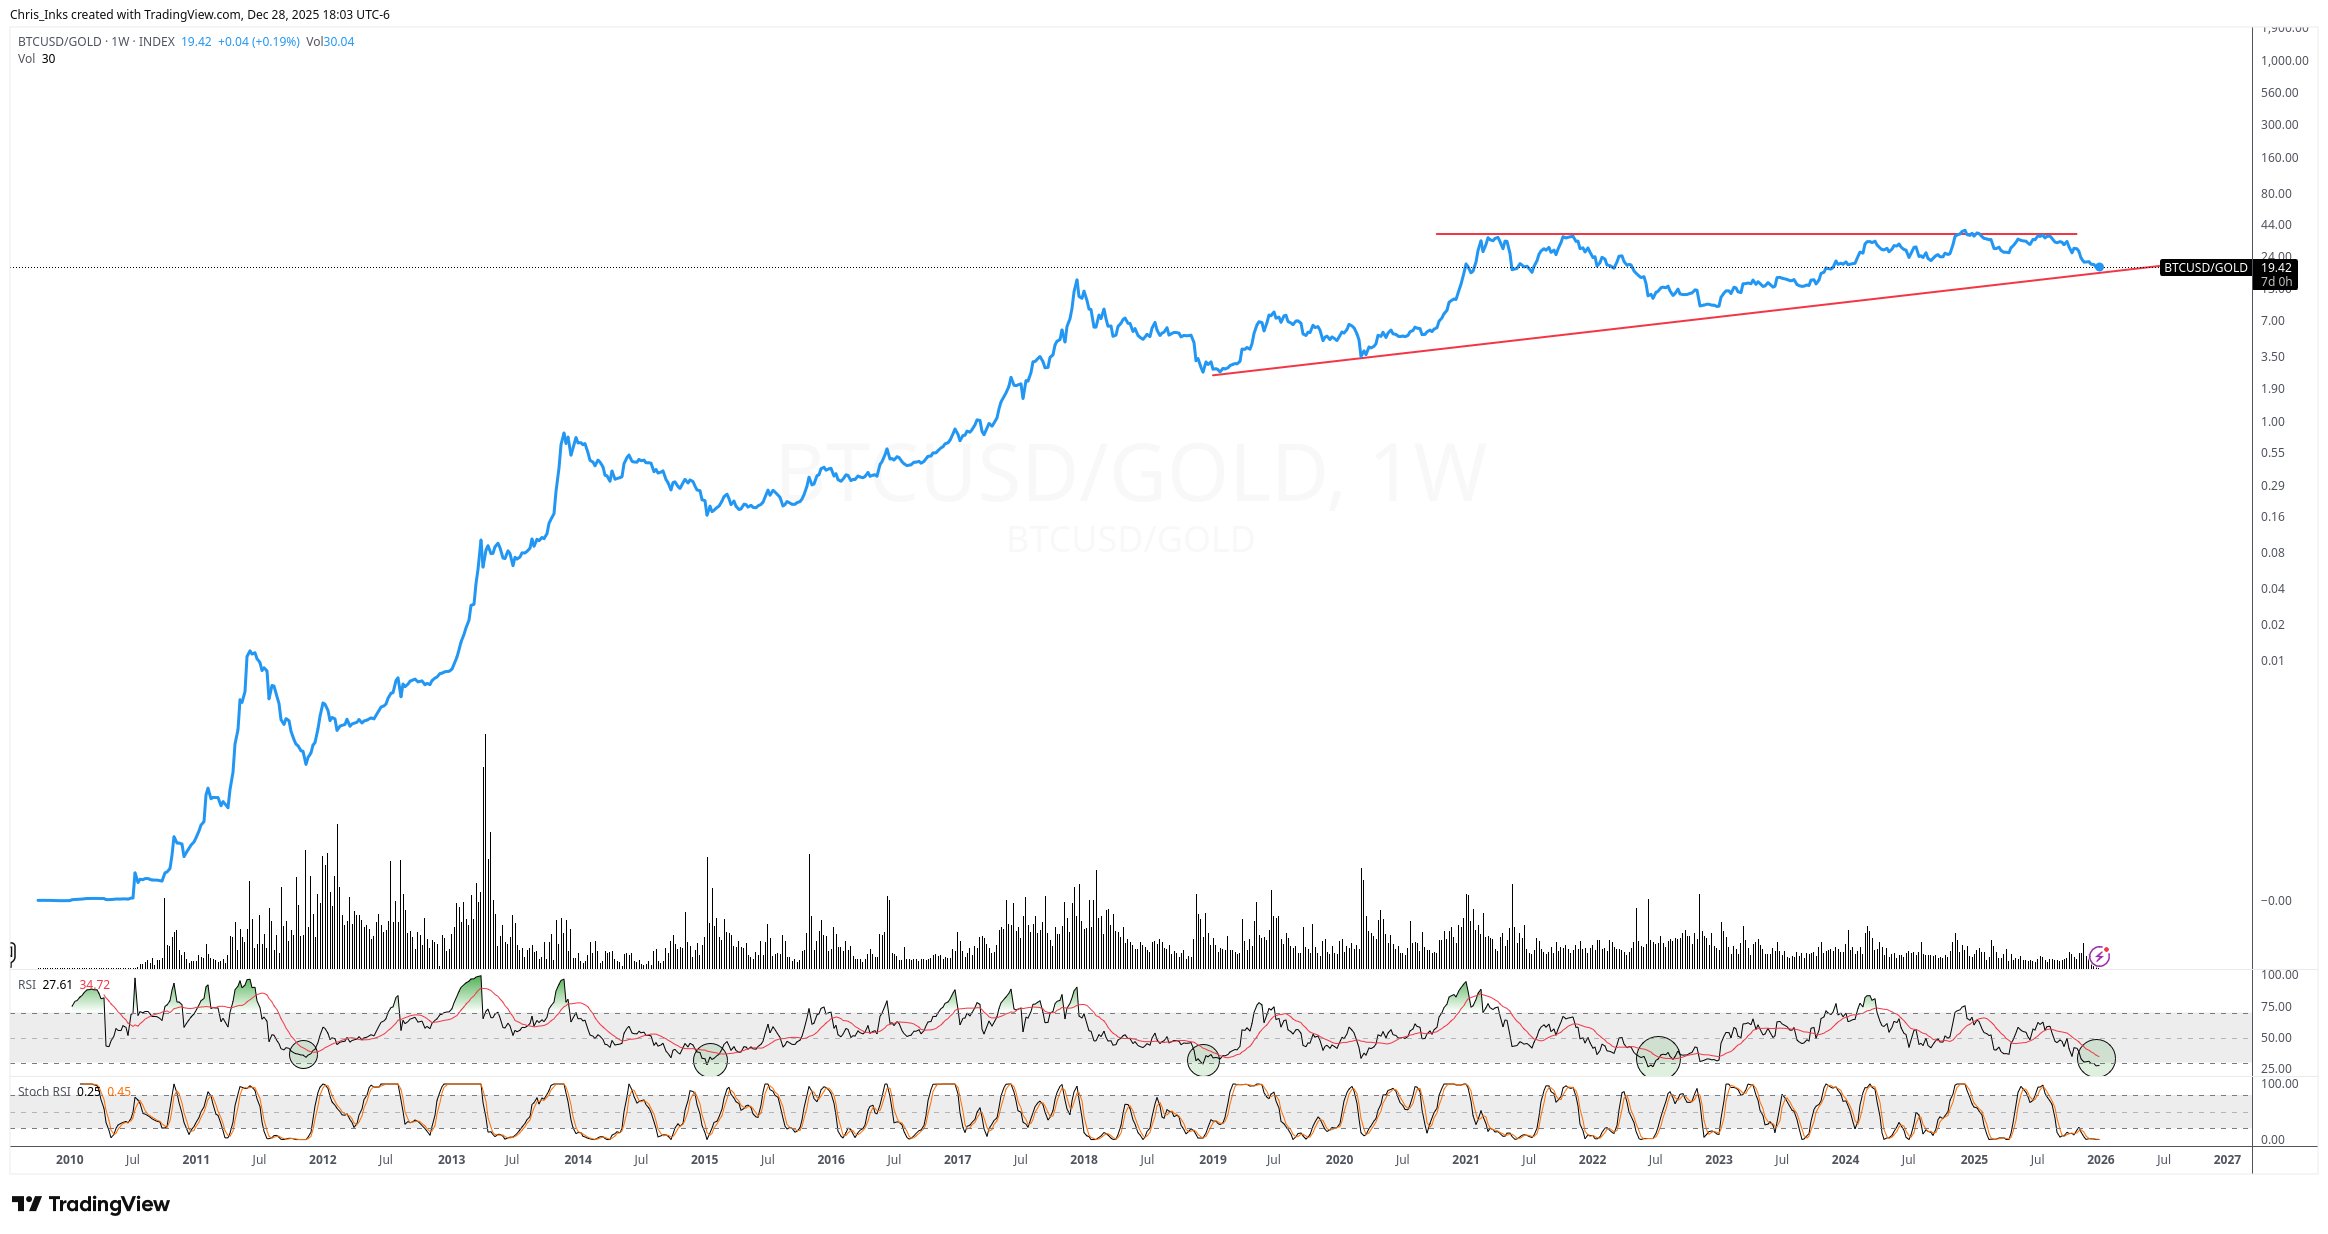
In addition, like Yildirim, Inks also references the RSI in the weekly chart. “Every time in Bitcoin’s history when the RSI in this chart has fallen into oversold territory, it marked the bottom of the respective correction. That doesn’t mean that it necessarily has to be the same this time – it can always be different.”
On-chain data: Realized losses remain high
While technical traders wait for clean setups, on-chain data shows a mixed picture. Glassnode Lead Analyst CryptoVizArt reports via

The second sentence is crucial: “Although the price has stabilized above the true market mean (US$81,000), selling at a loss, triggered by the time-related frustration of the top buyers, has not decreased significantly.” This means that the bottom may still not be reached.
Axel Adler Jr. interpreted the same loss dynamic as a “regime shift” after a capitulation phase. In his Morning Brief (“Capitulation Behind Us: Seller Pressure Down 80%”) he summarizes the core thesis as follows:
“Three months of data show a radical regime change. November’s capitulation, with a Z-score between 8 and 11, marked the maximum stress point of the cycle. Since then, the 7-day average of realized losses has fallen from $2.4 billion to $0.5 billion, a decline of around 80 percent.”
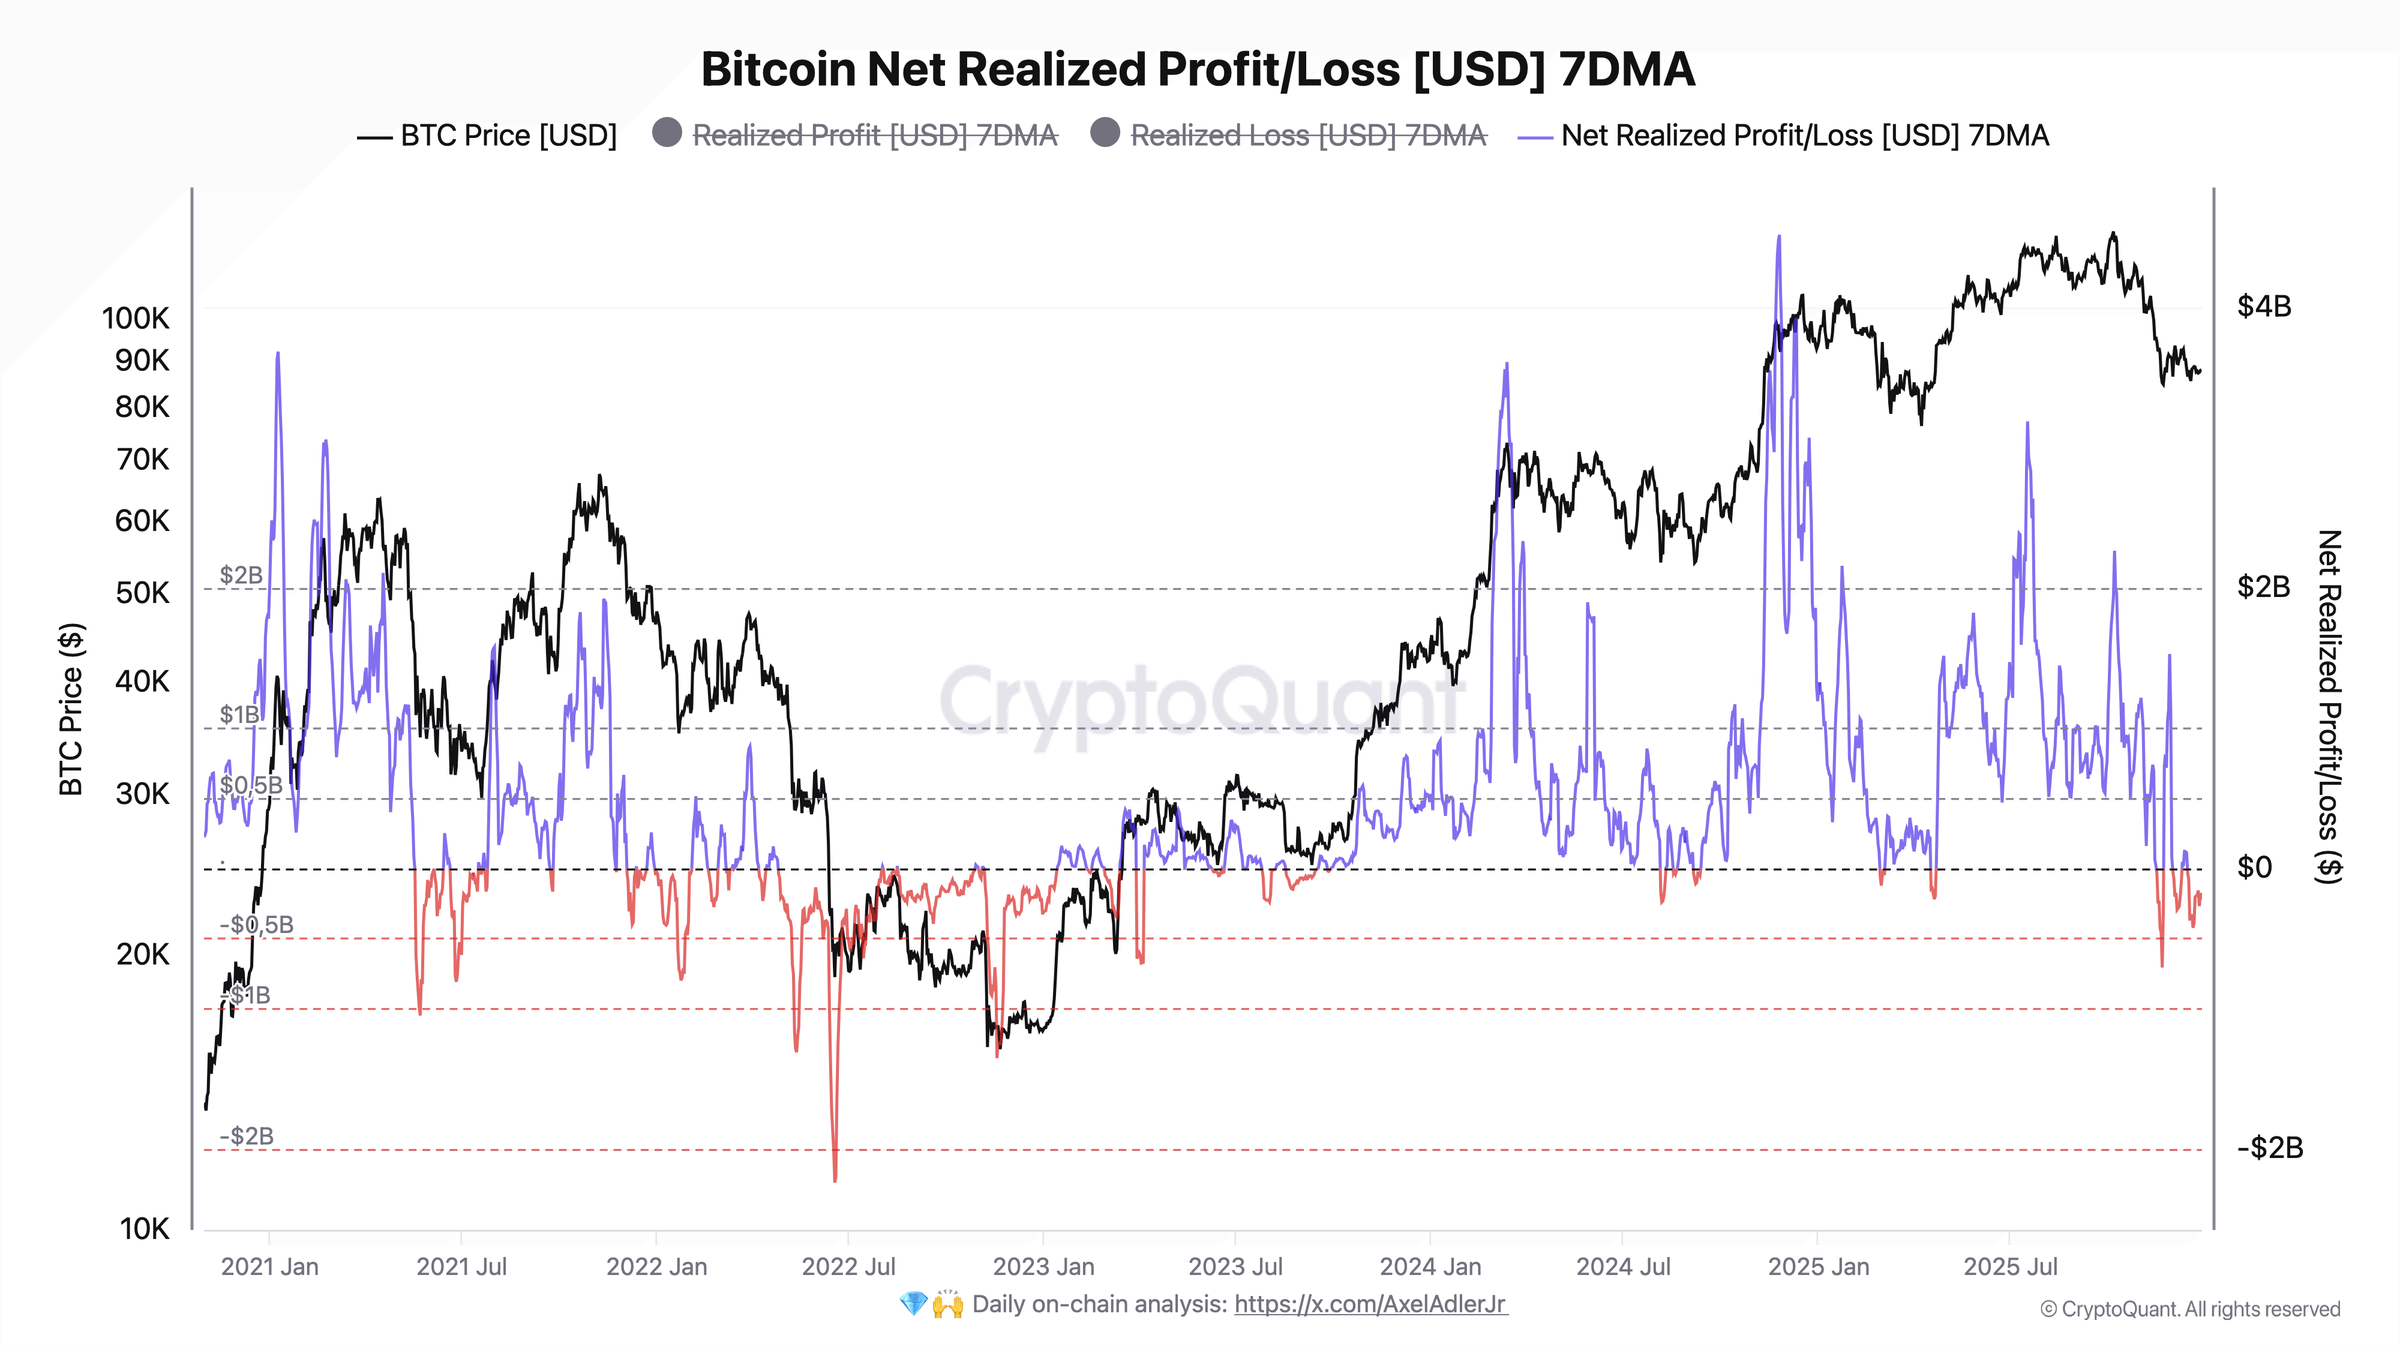
Adler also refers to the “Bitcoin Net Realized Profit/Loss (7D SMA)”: Although the value is still negative, the direction is “clearly upwards,” and the depth of the negative swings “almost halved” in the last week of December. According to Adler, the approach to the zero line is a harbinger of a change in mood, but explicitly conditional: a real turnaround requires new demand.
The bottom line is that at the end of the year, Bitcoin looks less like a trend market than like a market that is in the discovery phase. However, this is not unusual either. The turn of the year is traditionally a quieter phase on the financial markets. Technically, the $95,000 level remains the key resistance, while $84,000 is key support for the bulls.


No Comments