Bitcoin on a Steep Trajectory: New All-Time past $118K- What is Fueling BTC Price?

- Bitcoin reached a new all-time high at $118,403.89 before settling.
- A 67% spike in trading volume and strong on-chain data are signaling strong momentum.
Bitcoin had touched a new all-time high of $118,403.89 two hours back. While the price came down a notch lower, currently the coin is still trading around $118k, 6% up for the day and 9% for the weekly chart.

Current market cap has swelled to a whopping $2.34 trillion, a reflection of fervent investor demand and overall marketplace sentiment.
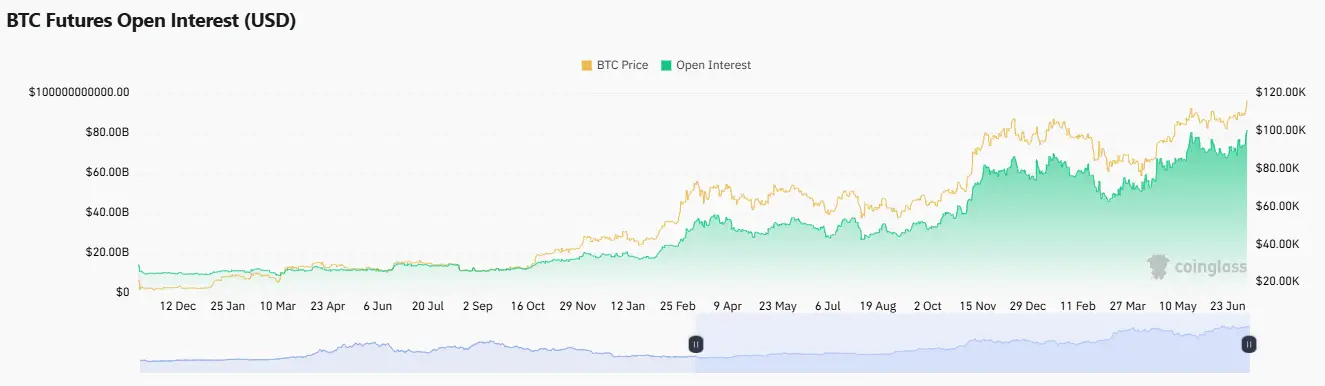
A deeper look at marketplace action shows the number of trades skyrocketed 67.42%, to a 24-hour count of $164.99 billion. Open interest likewise increased 5.64%, to $83.98 billion, as the number of options rose 82.22% to a total of $9.46 billion, according to CoinGlass.
These numbers reflect rising participation by traders and rising usage of leveraged bets, which are both indicators of strong belief by retail and institutional investors.

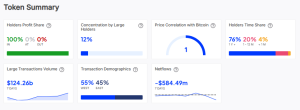
IntoTheBlock’s data shows a bullish view from a holding standpoint. All wallet holders are now in profit, indicating that all holders of Bitcoin have reaped the benefits of the recent surge. Long-term holders are the ones leading the pack, with 76% of the wallets holding the token for a year now.
Major players control about 12% of the supply, a middle concentration ratio that reflects decentralized control. Transaction demographics reflect a slim domination by the Western markets at 55%, with the remaining 45% comprised of the Eastern areas.
Bitcoin Maintains Bullish Momentum Above All Key EMAs
The current uptrend has broad technical support. The price of Bitcoin has been decisively above key exponential moving averages. The 20-day EMA is at $109,343, whereas the 200-day EMA is lower at $96,221, which marks a considerable distance that highlights the bullish predominance of the trend.
Candle configuration shows a continuing higher low build-up since the start of the month of July, which is reinforced with rising volume. RSI climbed to 73.27, which propels it into the overbought category.
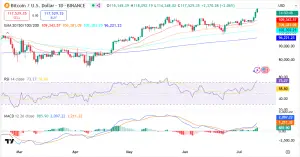
In the past, these readings often signaled short-term dips or consolidations. But the previous RSI resistance near 60 becomes new support, which suggests the trend proceeds unabated.
MACD readings substantiate the optimism, with the MACD line significantly higher than the signal line. The histogram continues to widen to the upside, showing increasing positive momentum. A significant crossover in early July was a confirming signal for the ensuing upward phase, and the strength has simply gained momentum since then.
Eyes on $120K, But Bigger Targets Loom Ahead
Now that Bitcoin has traded past the $117K, the subsequent near-term level to watch still remains the psychological resistance at $120K.
There are traders waiting for healthy corrections back down through the $115K level retests. The setup still favors further upside action given the volumes continue to hold up and macro conditions remain stable.
Down the line, the long-term potential could reach as high as $184,181, predicts market watcher CryptoCon. By way of historical extension models, past cycle highs have exhibited similar tendencies, which indicate the current surge of Bitcoin could still have a ways to go.
No matter where you look, the next step for Bitcoin seems to be between 170 and 180k.
Using a 5.618 extension from the earliest move of the cycle has given us almost pinpoint accuracy for previous cycle tops.
This time, the golden number is $184,181.
All the boring price… pic.twitter.com/TJ4ua89IR2
— CryptoCon (@CryptoCon_) July 10, 2025


No Comments