Bitcoin is slipping into the bear market: Glassnode names the next price targets

- Glassnode sees Bitcoin True Market Mean as new resistance, while $70,000-$80,000 is the first demand zone.
- Despite possible buyer zones, realized losses are increasing and the derivatives/options market remains defensive. Without visibly increasing spot demand, any recovery is likely to be more corrective than a real trend reversal, according to Glassnode.
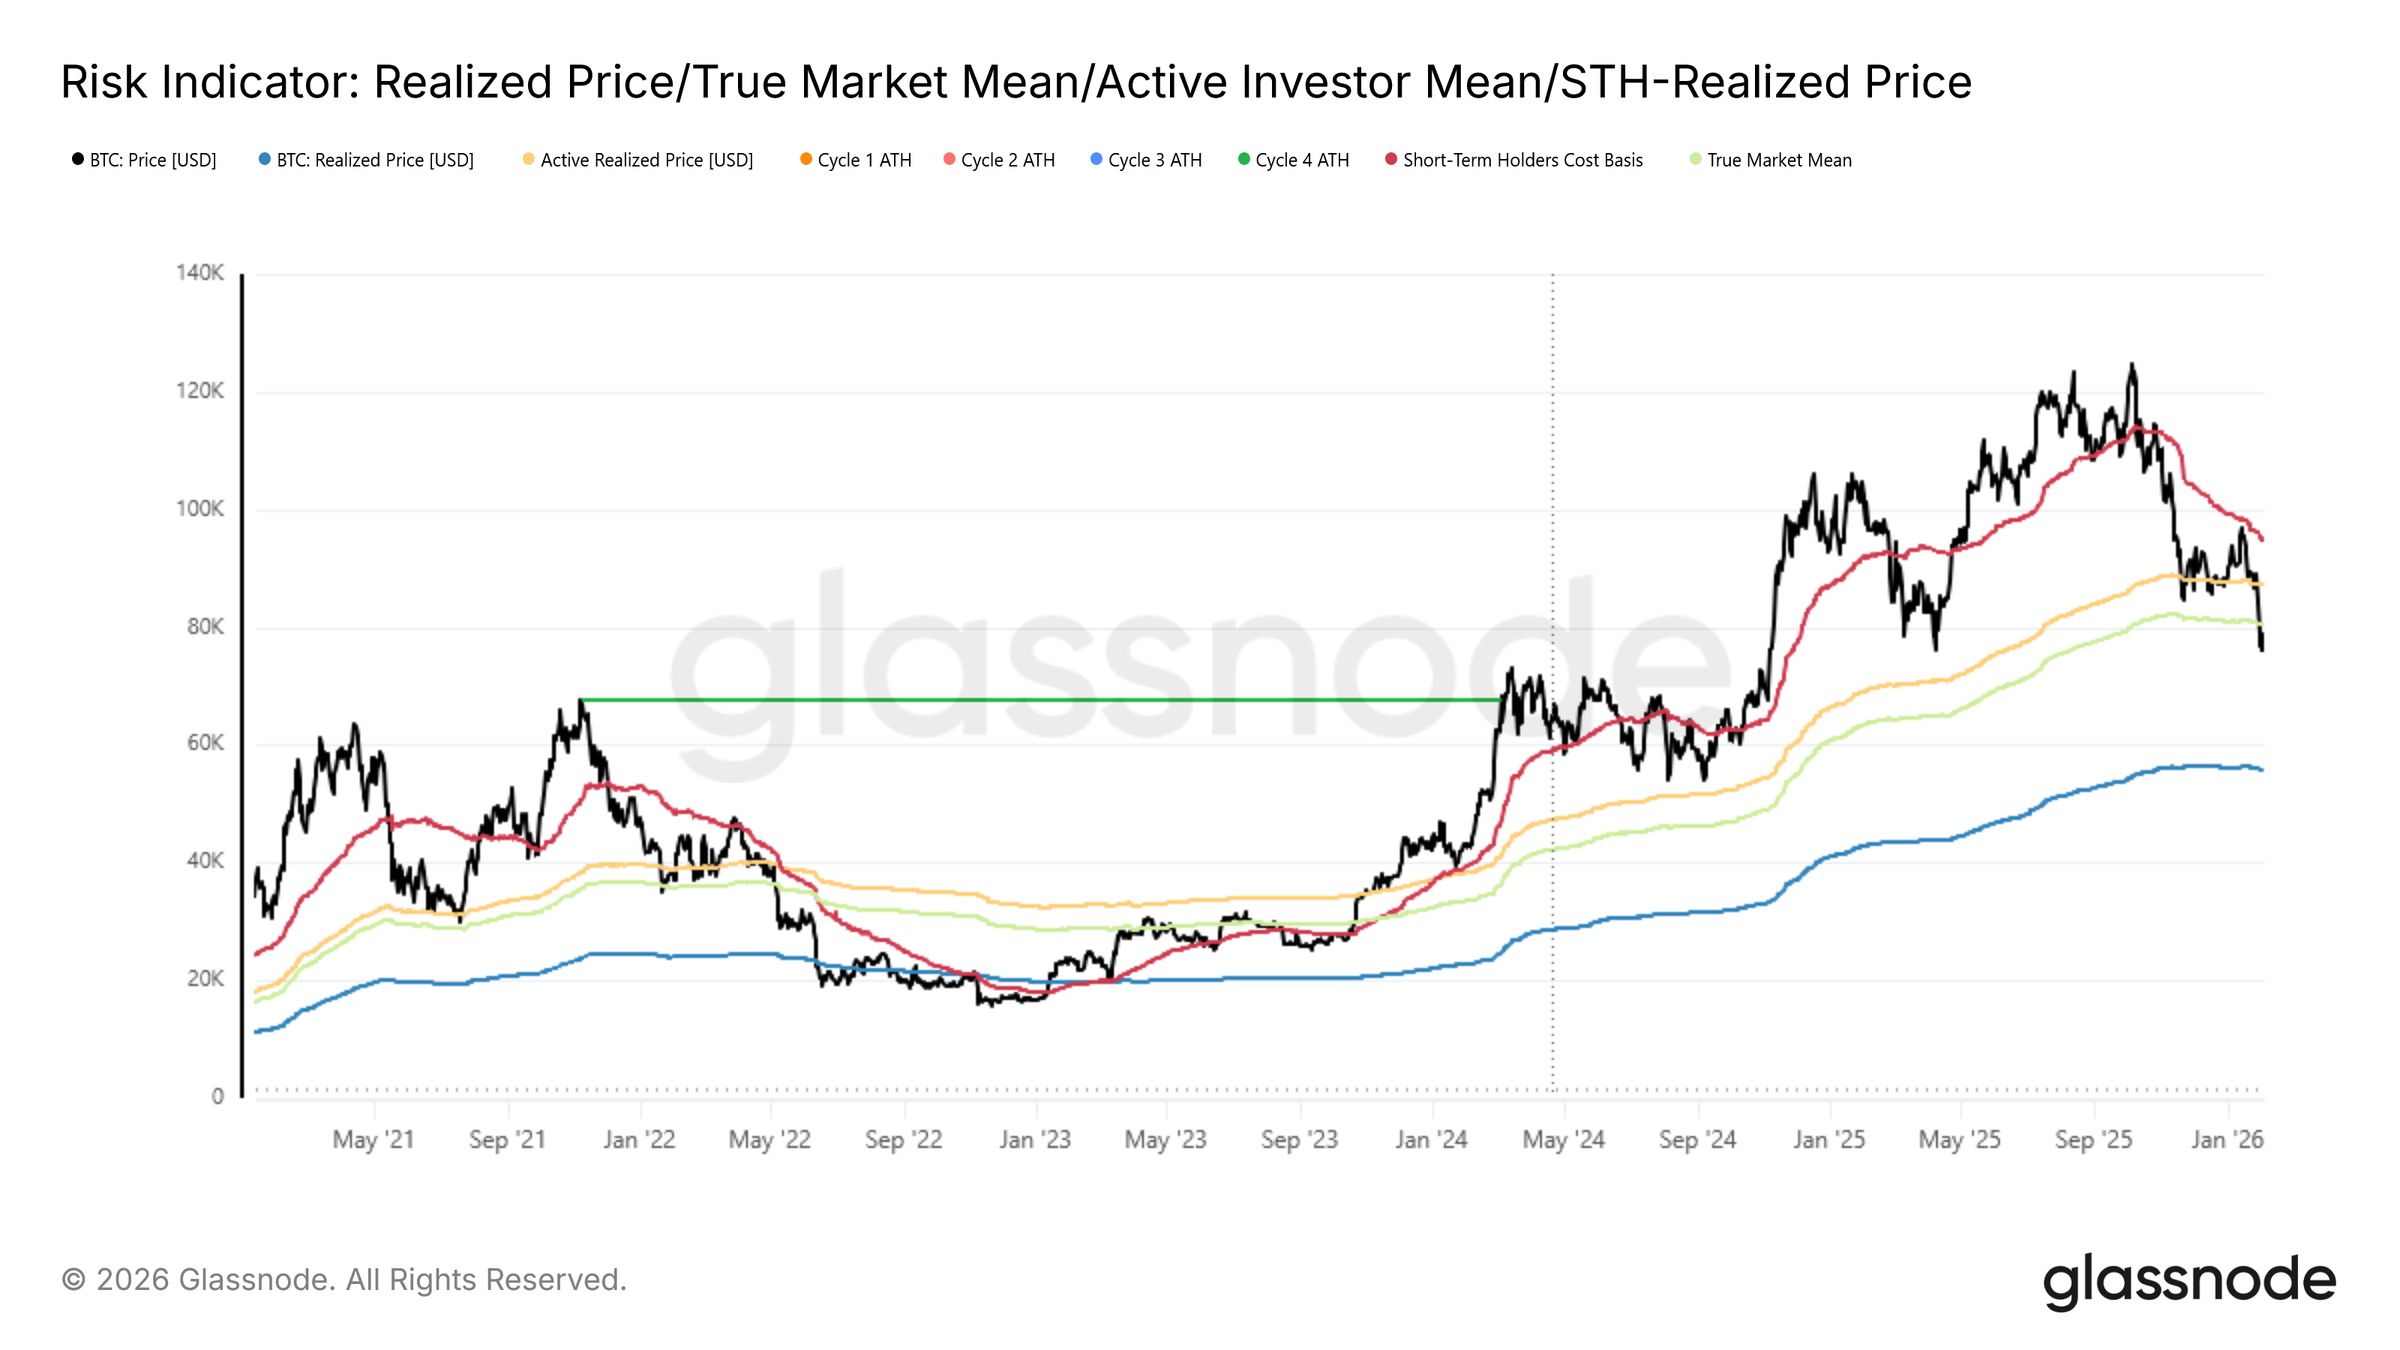
According to Glassnode, Bitcoin hasWeekly report from February 4th lost central technical and on-chain support: the price fell below the “True Market Mean”. This brings a clearly bearish regime to the fore, but it remains unclear how long this phase will last this time.

According to Glassnode, the True Market Mean is an important anchor for the actively circulating coins, which has repeatedly acted as the last support line in the previous “shallow bear phase”. Glassnode interprets the fact that Bitcoin is now falling below this mark as a signal that the bear market is entering a confirmed phase, drawing parallels to 2022.
How low can the Bitcoin price fall?
The true market mean is currently around $80,200 and is now becoming crucial resistance. Below, Glassnode points to the “Realized Price,” which is currently around $55,800 – a historical area where long-term capital typically becomes more active again.
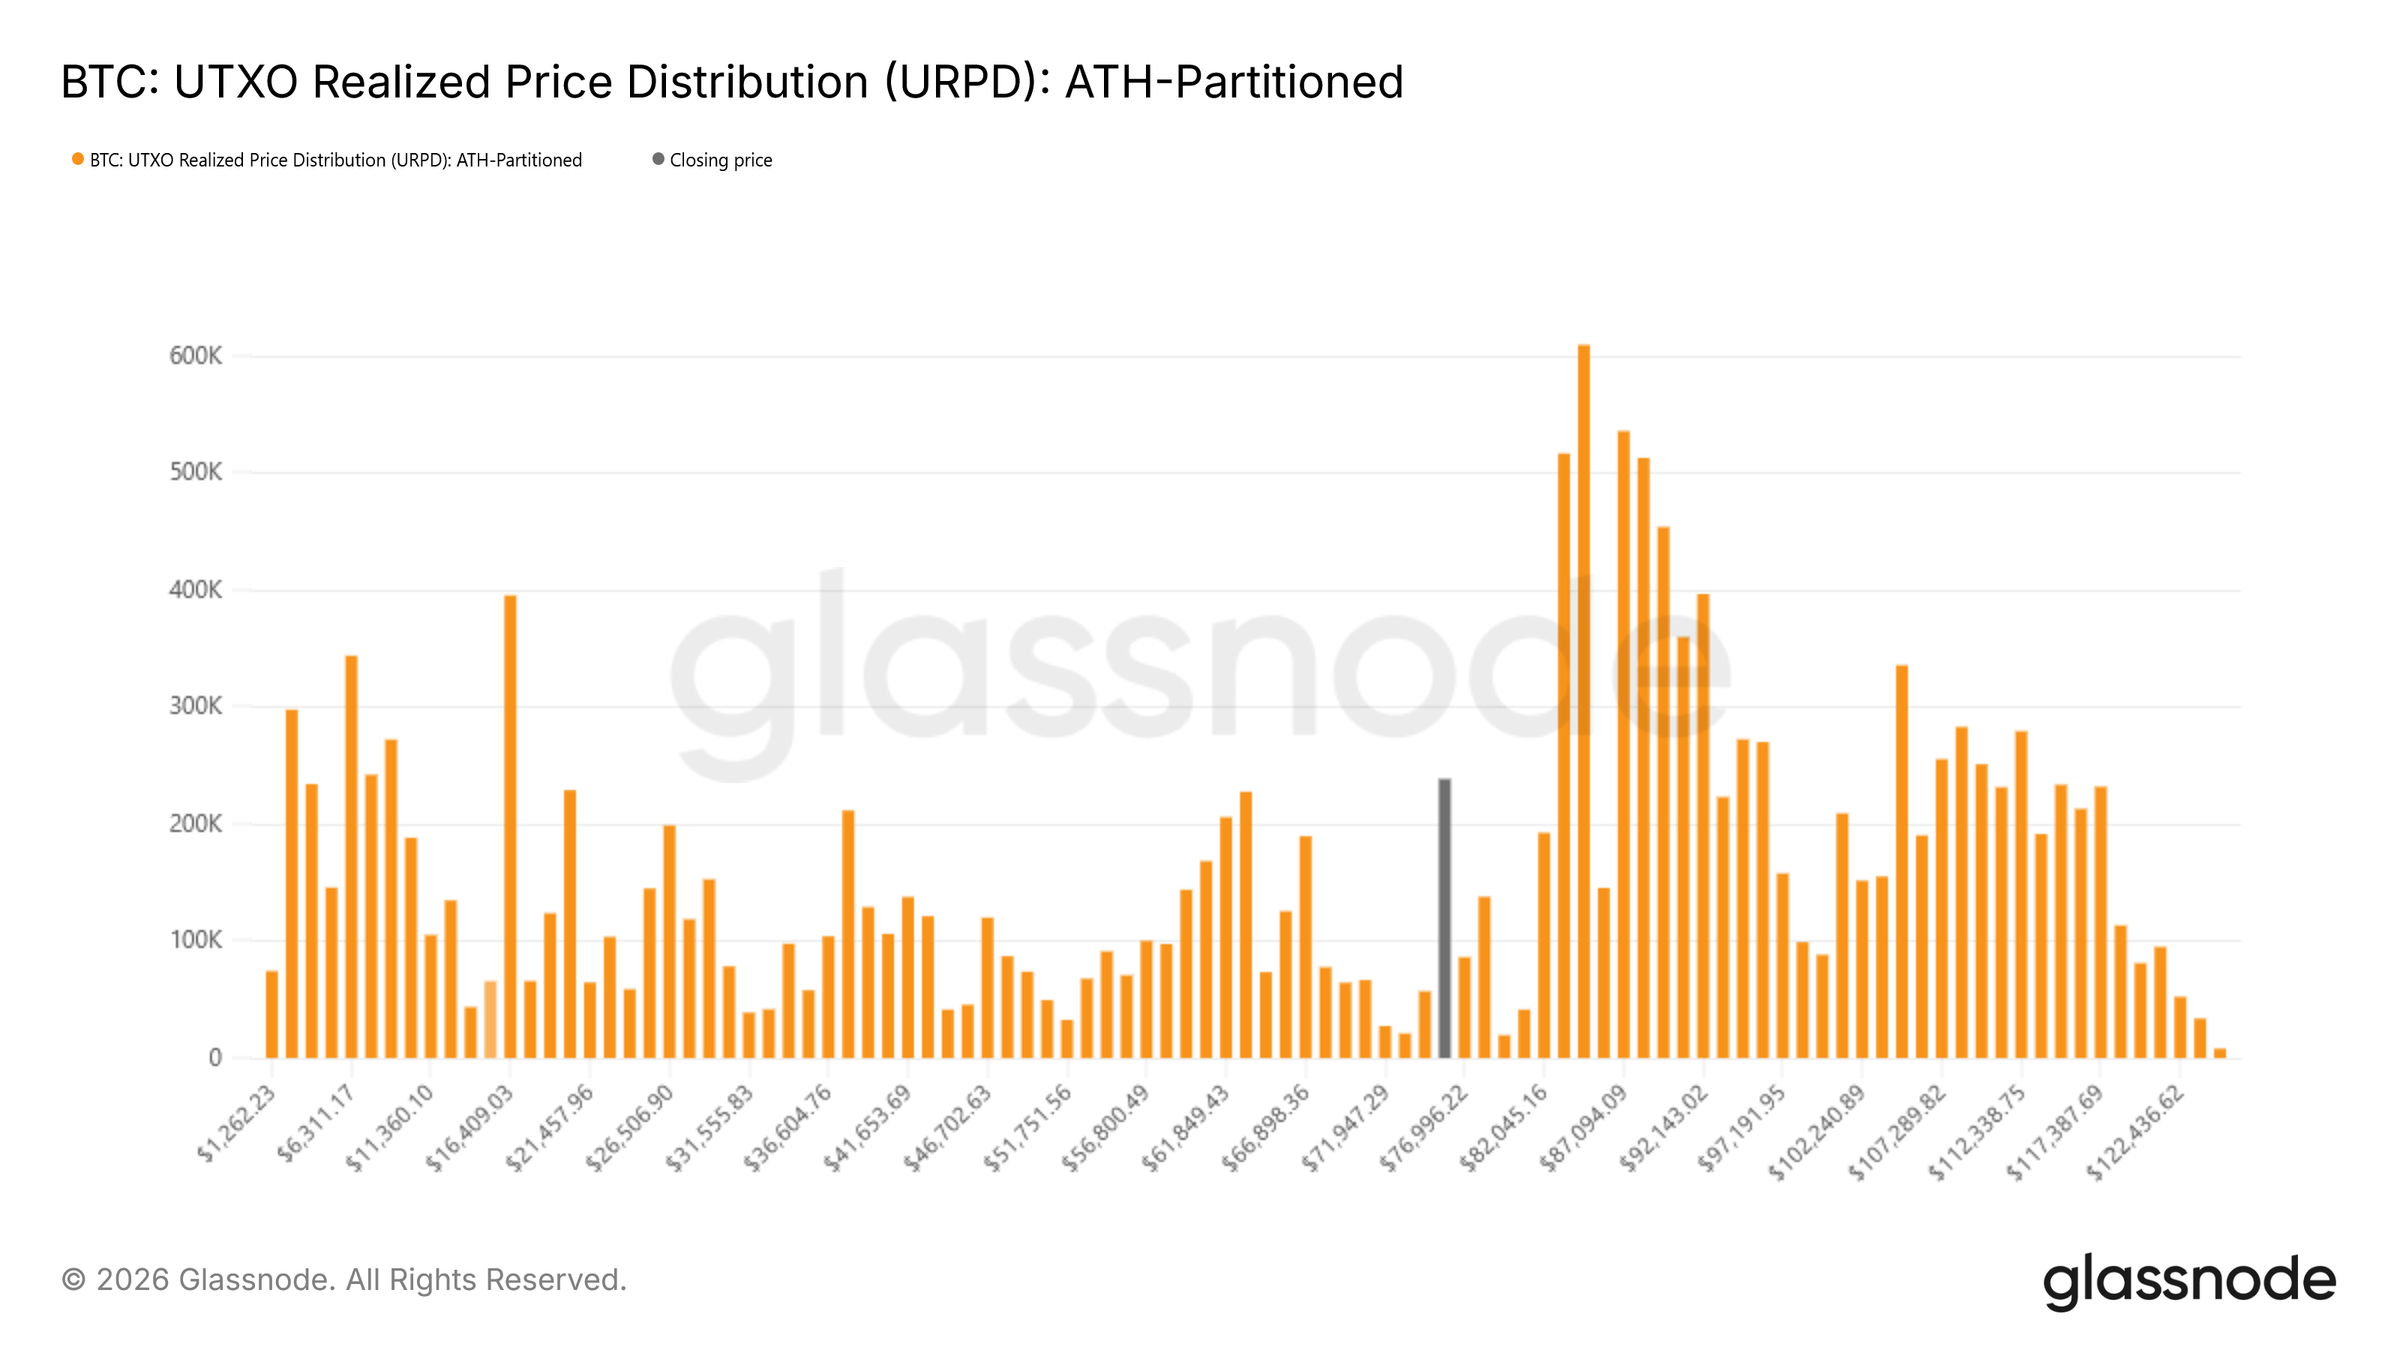
For short-term price ranges, Glassnode refers to the UTXO Realized Price Distribution (URPD), i.e. the distribution of the UTXO cost bases across price levels. Glassnode writes:
“Current distributions show notable accumulation of newer entrants in the $70,000-$80,000 area, suggesting early positioning of buyers ready to absorb weakness at these levels. Below this zone, a dense supply cluster between $66,900 and $70,600 stands out as a particularly compelling area. Historically, zones with highly concentrated cost bases often act as short-term ones Shock absorbers where selling pressure is more likely to meet responsive demand.”

At the same time, the report provides a second, less comfortable signal: measurable stress in the market is increasing. Glassnode writes:
“During the current contraction, the 7-day simple moving average of realized losses has risen to over $1.26 billion per day. This reflects a significant increase in fear and frustration following the loss of true market mean. Historically, spikes in realized losses often coincide with periods of acute seller exhaustion where marginal selling pressure begins to fade.”
The report also gives a concrete example: When the rebound from the 72,000 region occurred, the daily realized losses briefly jumped to over 2.4 billion US dollars – almost double the 7-day average at the time.
According to Glassnode, such extreme values often mark short-term turning points at which forced sales turn into temporary stabilization. Importantly, this is not evidence of a cyclical bottom, but rather a pattern that suggests short-term exhaustion.
Trend reversal not yet foreseeable
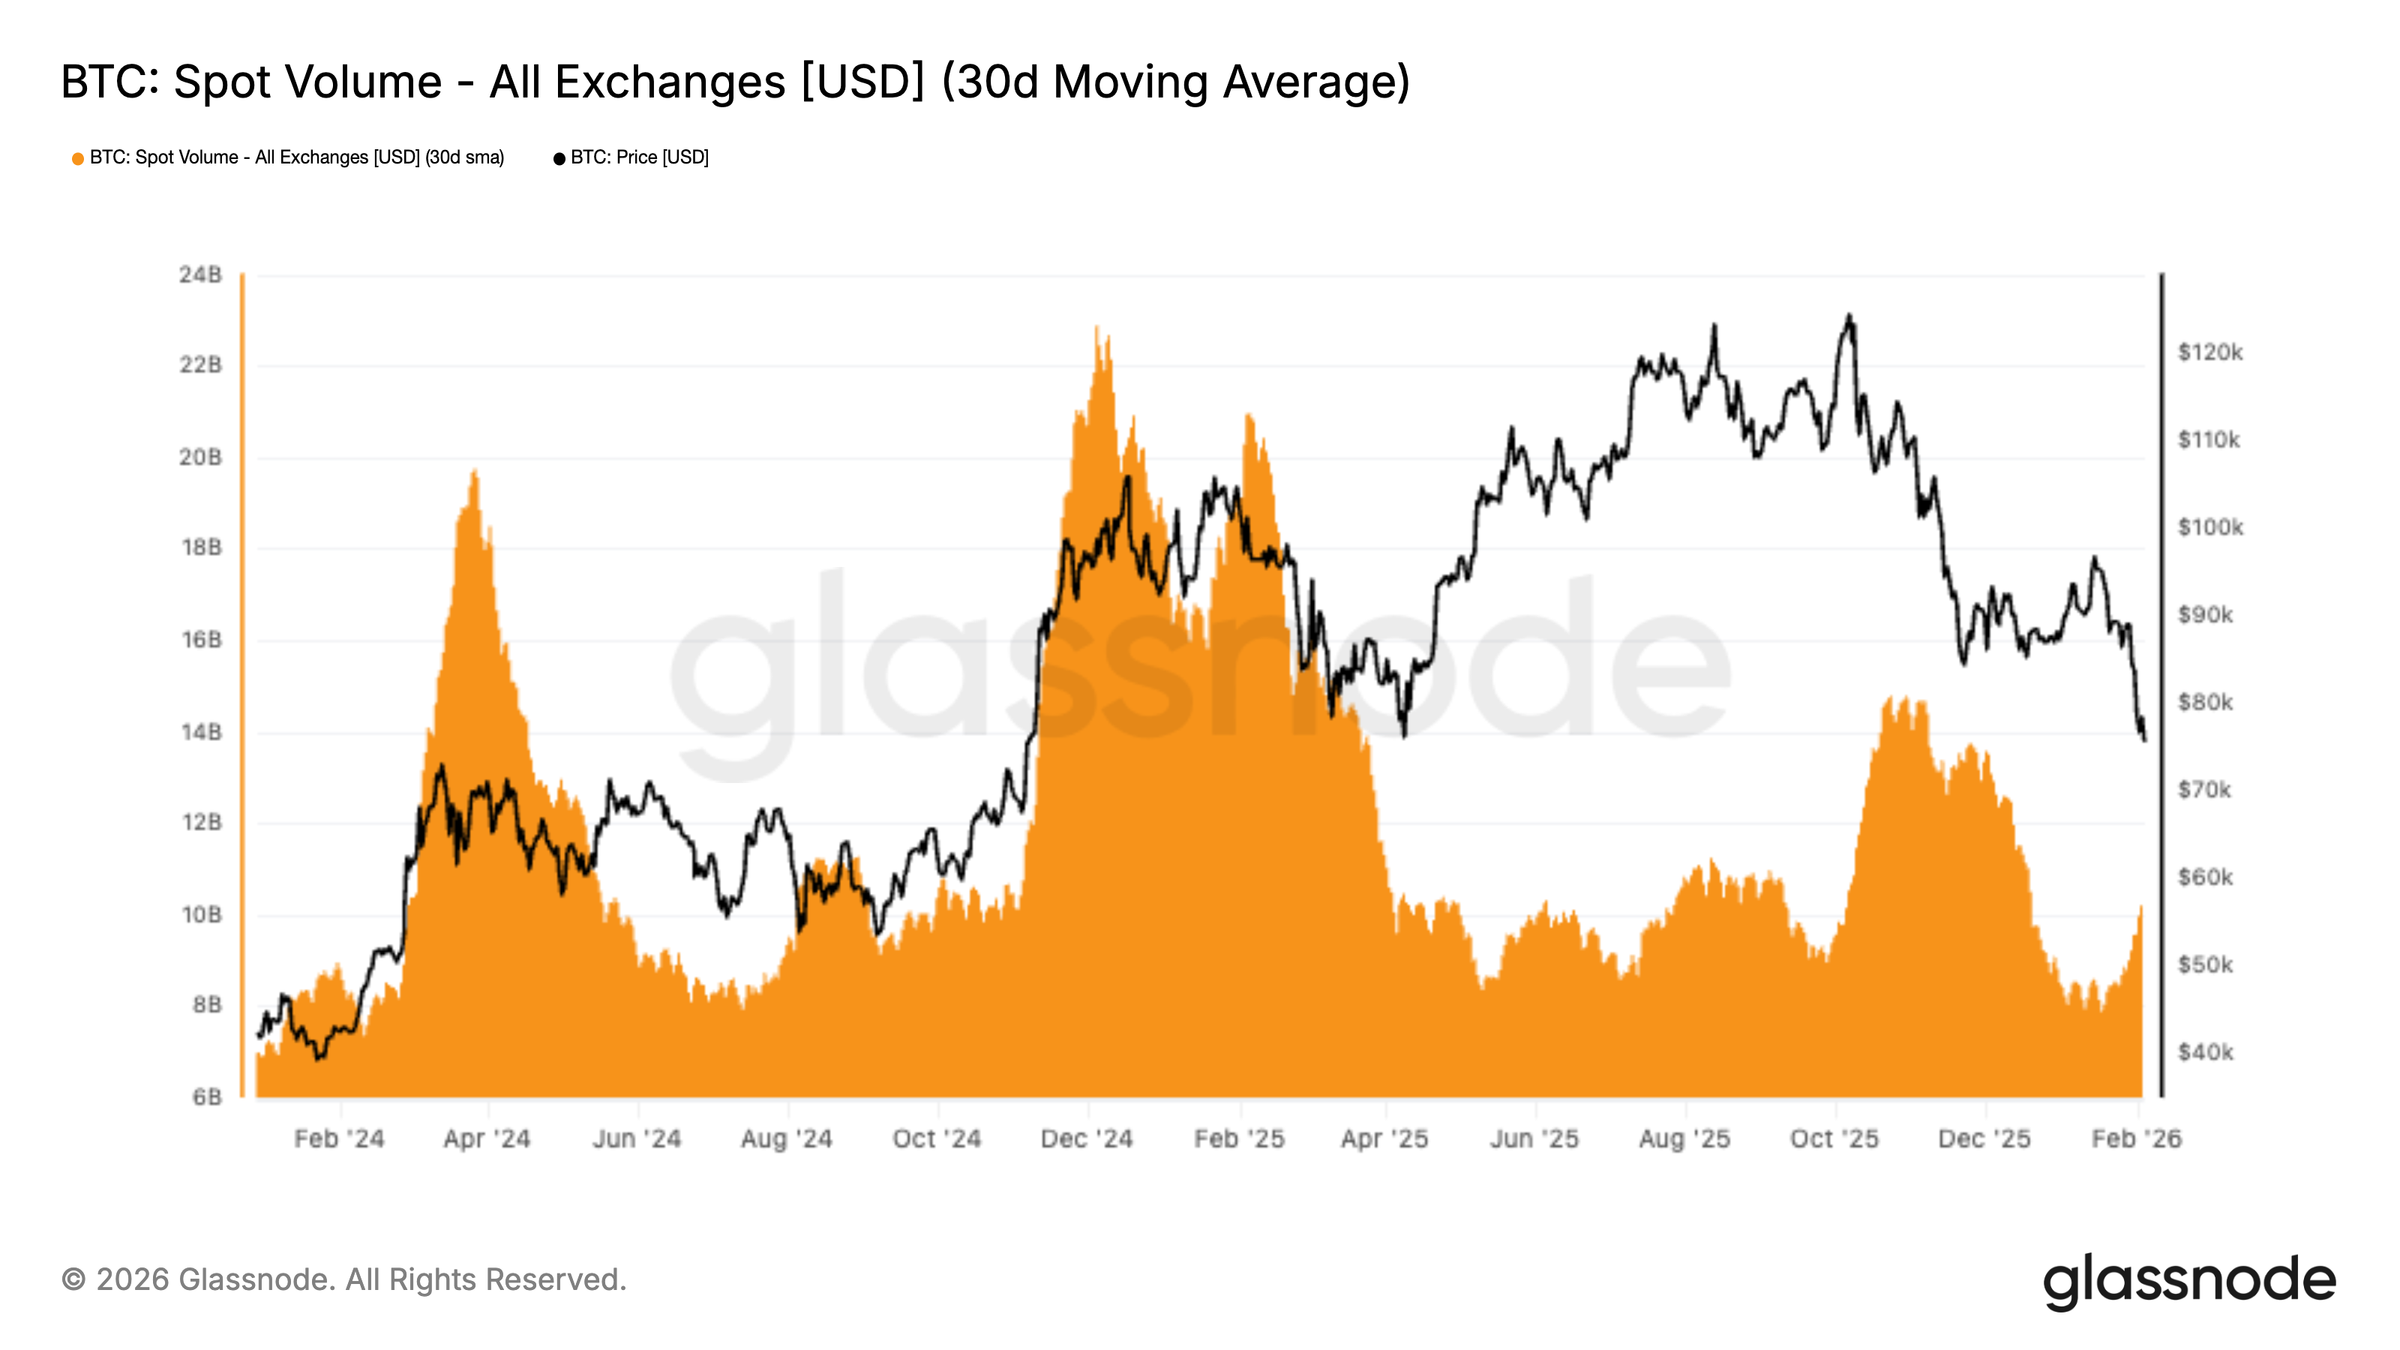
While the first buying zones are becoming visible on-chain, spot demand remains structurally weak, according to the report. The 30-day average of spot volume remains extremely low, despite Bitcoin falling from $98,000 to $72,000 – a rather bearish sign:
“Historically, resilient reversals have been accompanied by spot volume rising aggressively as new demand is ready to take over the other side. In this case, volume has increased only moderately in the decline, suggesting that activity is largely reactive and dominated by distribution and de-risking rather than belief-driven accumulation.”
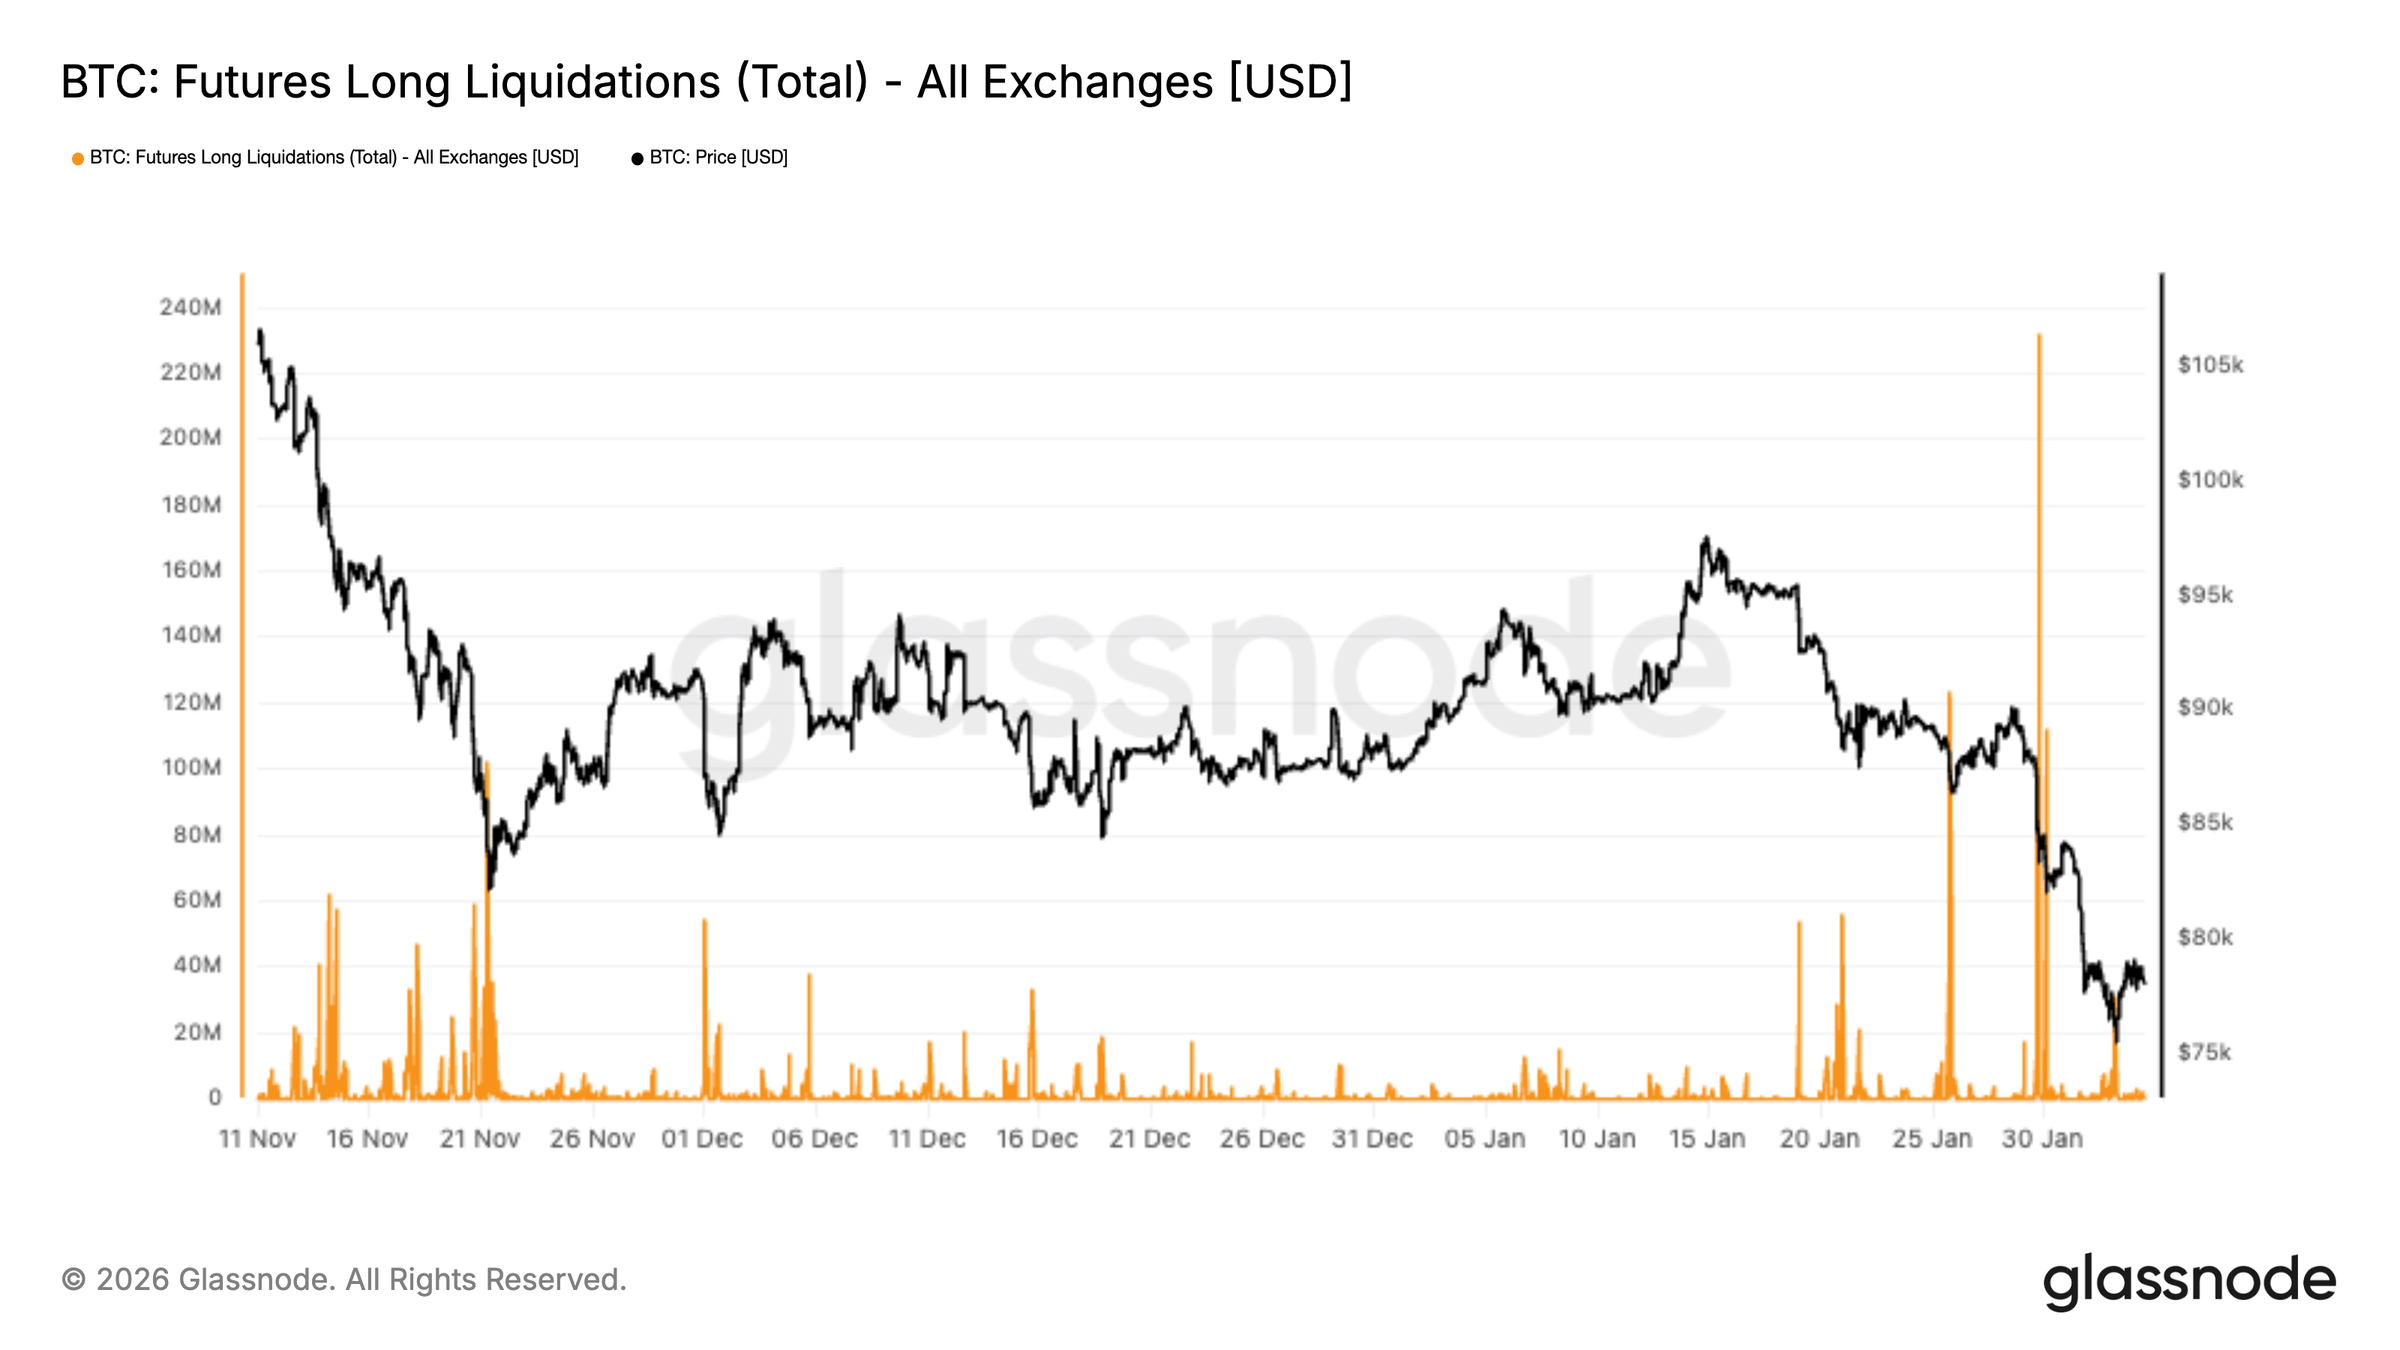
At the same time, long positions were liquidated hard on the futures markets, which further strengthened the downward momentum. The report emphasizes that a leverage reset is not in itself a bottoming signal – without real spot demand, the market remains vulnerable.
“From here on out, price’s ability to stabilize will depend on whether this leverage reset is enough to clean up excess risk or whether further de-leveraging is required. A sustained recovery typically requires spot demand to step in rather than relying solely on liquidation-driven positioning cleanups.”
The options market also remains defensive. Short-term implied volatility increased towards 70% when retesting the 73,000 region, and the 1-week IV is around 20 vol points above the level from two weeks ago. In addition: The downside skew becomes steeper – puts are in greater demand relative to calls. This keeps hedging costs high and shifts the probability further towards negative outcomes.
Additionally, the 1-week volatility risk premium has turned negative:
“The 1-week volatility risk premium has turned negative for the first time since early December and has fallen to about -5. This is a sharp reversal from about +23 a month ago. A negative volatility risk premium means that implied volatility is now trading below realized volatility.”
For market makers and gamma sellers, this is a constellation that can increase hedging activity – and thus increase short-term volatility. Glassnode summarizes the situation like this:
“With leverage flushed out but spot demand still lacking, the market remains vulnerable and any recovery rally is likely to be corrective rather than reversal.”
This means that the price zones mentioned in the report are now the crucial reference points: $80,200 as resistance (True Market Mean), $70,000-80,000 as the first demand zone, $66,900-70,600 as a cost base cluster and $55,800 (Realized Price) as a historical area in which long-term buyers have often become more active again in the past.
As CNF reported yesterday, Galaxy Digital also warned in its latest report that the BTC price could fall as low as $58,000.


No Comments