Analyst: Bitcoin price could fall to USD 80,000 – opportunity to buy again?
- After Bitcoin broke below the key $90,000 mark, a correction to $80,000 seems likely, according to analysts.
- The Fear and Greed Index has fallen to “Extreme Fear”, reflecting the current nervousness of many investors in the market.
At the time of writing, the Bitcoin price is at USD 86,350 and has recorded a slight increase of over the last 24 hours 0,86%. On a weekly basis, the Bitcoin price recorded a decline of 6,16 %while on a monthly basis there was a minus of 8,70 % results. Compared to the entire crypto market, BTC is showing a moderate short-term correction.

Both ETH and the broader altcoin market are also recording significant losses, often in the double-digit range. ETH and BNB are falling more than 7%XRP even 14% on a monthly basis. SOL falls 9%DOGE even 18%. A complete overview of the prices of over 5,000 cryptocurrencies can be found in our price overview.

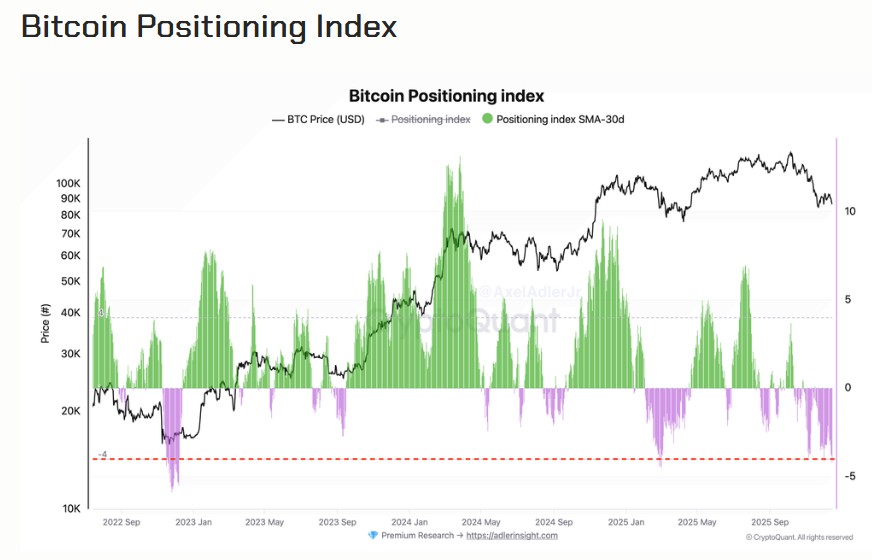
According to on-chain analyst Axel Adler, the main cause lies primarily in the derivatives market. The futures market is clearly under bearish pressure driven. Two central indicators provide consistent signals: the Bitcoin Position Index and the Fear and Greed Index.
The Bitcoin Positioning Index serves to clearly reflect the current direction of the derivatives market. It combines the open interest, i.e. the number of all futures and options positions still open, with the funding rates, which show whether long or short traders bear the higher financing costs. In this way you can see whether the majority of market participants are betting on rising or falling prices.
The current value of minus four is clearly in negative territory. This means that short positions clearly dominate and many traders actively hedge against rising prices or specifically speculate on further falling prices.
The market is therefore not in a short-term correction, but in a clearly bearish environment. If prices continue to fall in this phase, this confirms the underlying market structure: sellers set the tone, while buying interest only appears sporadically and without noticeable assertiveness.
A possible trend reversal would only become apparent when the market structure noticeably improves and the positioning index rises above the zero line again, which would indicate that long positions outweigh short positions. At the same time, the Bitcoin price would have to break through a number of important resistance levels.
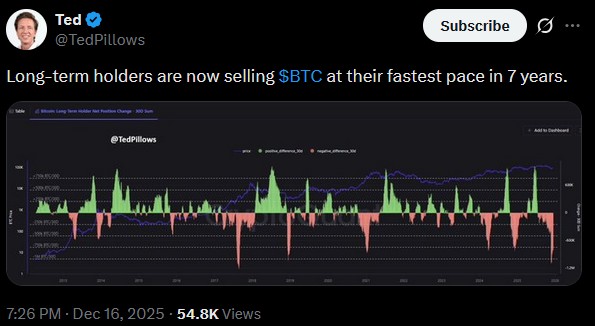
Sea Analyst Ted Long-term BTC hodlers are currently selling their holdings as quickly as they did 7 years ago. Such a development can often be observed at the end of a bullish cycle, as the diamond hands then also realize profits and this creates strong selling pressure.
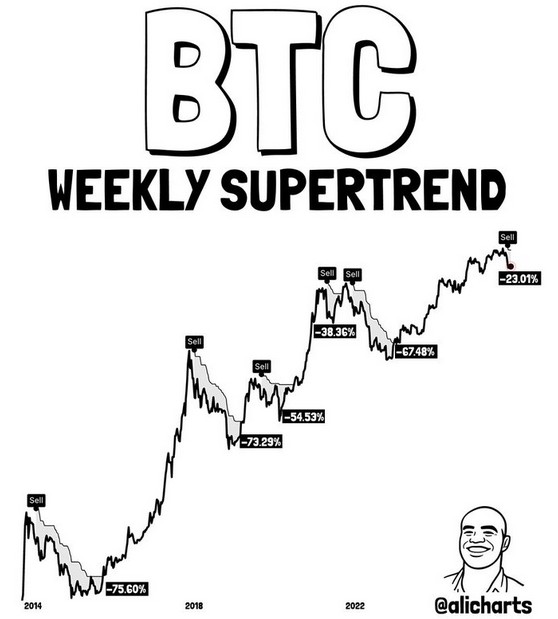
Technical analyst Ali Charts warns ahead of a possible sharp decline in Bitcoin as the SuperTrend indicator on the weekly chart recently triggered a sell signal. Historically, such signals have been followed by massive corrections, including declines of up to 75% in previous cycles such as 2014, 2018 and 2022.
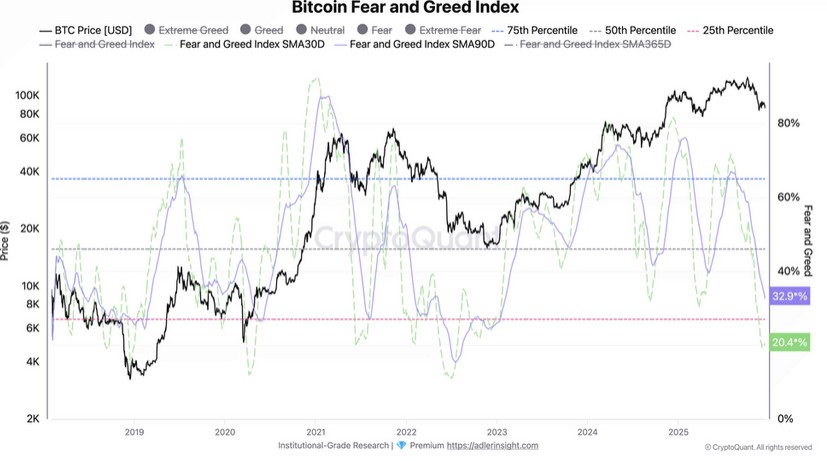
Fear and Gread Index shows extreme fear
The Fear and Greed Index attempts to translate the gut feeling of the Bitcoin market into a number. It ranges from 0 to 100, with very low values representing fear and high values representing euphoria. Several factors are taken into account in the calculation, such as how much the price fluctuates, how much is traded, in which direction the market is moving and how the mood in social networks is developing.
The index is currently deep in extreme fear territory. This is typical of phases in which many investors become nervous, reduce positions and prefer to play it safe. What is striking is that this fear is not a brief blip. The 30-day average is around 20, the 90-day average is around 32.
This development clearly shows that the mood has been deteriorating step by step for months. It is important, especially for first-time buyers, to understand that extreme fear does not automatically mean a good buying opportunity.
In the current situation it goes hand in hand with a clearly bearish market structure. Many traders not only feel uncomfortable, they are actively betting that prices will continue to fall. The pressure on the market is therefore deeply rooted and not just the result of an emotional moment of shock.


No Comments