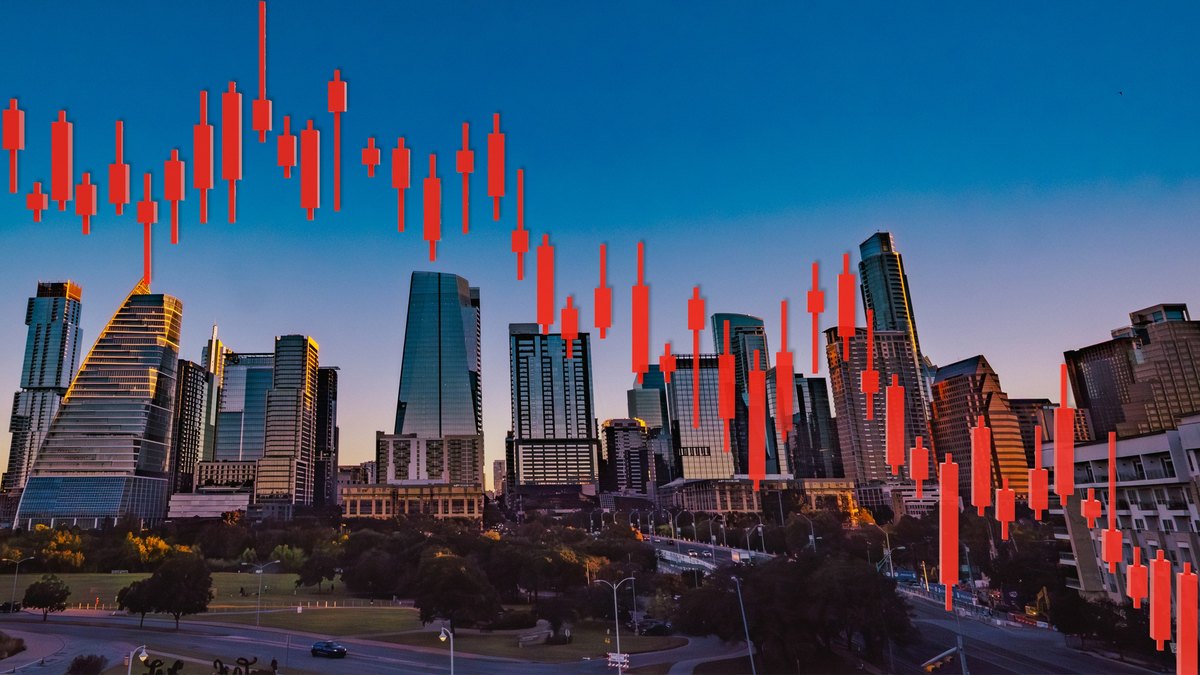
While the U.S. housing market cools into a seasonal late-summer transition, price drops are hitting some metropolitan areas much harder than others—and not necessarily where observers might expect. High mortgage rates and shifting local supply-and-demand dynamics have driven down list prices nationwide, though the pace of decline slowed in August compared to previous months. Sellers are trending toward more realistic pricing, and the market is seeing broader price corrections. Metro areas that experienced explosive growth during the COVID-19 pandemic are now recording some of the deepest cuts in price per square foot.
National Price Trends Show Broad Correction
In August, the price per square foot—a metric that controls for the size of homes on the market—decreased year over year for the tenth consecutive month. Nationally, housing prices per square foot are down 1.8% year over year. Median list prices fell annually in three of four regions: the Northeast dropped 3.6%, the South declined 2.6%, and the West fell 2.1%, while the Midwest remained flat. At the metro level, the median list price per square foot fell in 36 of the top 50 metros in August, another sign that it’s game over
for unrealistic seller demands.
Metro Areas with Steepest Price-per-Square-Foot Declines
The largest price-per-square-foot declines in August were in Austin, TX (-8.1%); Tampa, FL (-5.6%); and Memphis, TN (-4.1%). The largest gains appeared in Providence, RI (+9.3%); Indianapolis (+4.4%); and Chicago (+3.6%). Among the 50 biggest metro areas, the following recorded the biggest annual declines in listing price per square foot:
- Austin-Round Rock-San Marcos, TX: -8.1% | Median listing price: $450,000
- Tampa-St. Petersburg-Clearwater, FL: -5.6% | Median listing price: $391,950
- Memphis, TN-MS-AR: -4.1% | Median listing price: $299,995
- San Francisco-Oakland-Fremont, CA: -3.9% | Median listing price: $908,700
- San Antonio-New Braunfels, TX: -3.6% | Median listing price: $324,450
- Denver-Aurora-Centennial, CO: -3.40% | Median listing price: $574,913
- Baltimore-Columbia-Towson, MD: -3.2% | Median listing price: $375,000
- San Diego-Chula Vista-Carlsbad, CA: -2.7% | Median listing price: $899,000
- Orlando-Kissimmee-Sanford, FL: -2.6% | Median listing price: $417,000
- Portland-Vancouver-Hillsboro, OR-WA: -2.4% | Median listing price: $595,000
Pandemic Boomtowns Lead Pullbacks
Realtor.com® senior economist Jake Krimmel says some of this market shift in these cities may be due to continual readjustment following the COVID-19 pandemic.
“One common thread for most markets—including Austin, Tampa, San Antonio, Denver—is 2020–22 boomtowns continuing to give back some of their pandemic-era gains. These are also, by and large, places with much more inventory now than pre-pandemic norms,” he says.
San Francisco’s Unique Dynamics
One outlier is San Francisco, where the market saw a 3.9% decrease in price-per-square-foot costs despite its status as an ultracompetitive market. In July 2026, active listings fell 16.3% from the previous year, tightening the housing market further. While the median listing price remains high at $908,700, it has decreased by 5.2% year over year.
Veronica Peter, a real estate agent with Compass serving the Fremont area on the southeastern edge of San Francisco near Silicon Valley, says the market is being affected by shifts in the tech industry. Many of her clients are quietly reeling as AI transforms their industry.
“A huge portion of our workforce in Fremont holds tech-related jobs such as software engineers, data analysts, and web developers,” she tells Realtor.com.
Many heavy tech hitters, including Oracle, Meta, Dell, Microsoft, and Amazon, have implemented quiet layoffs
as they restructure with AI in mind. The encroaching instability in the tech workforce has meant that while the housing market has certainly not crashed, pricing [has] adjusted to meet buyers where they are today,
she adds.
At recent open houses, Peter has heard similar sentiments: tech workers are uncertain about their employment and feeling the strain of high interest rates. Many also invested heavily in tech stocks, which have slumped this year.
“A softer stock market depleted the funds buyers were planning to use for their down payments,” she says.
Home listing prices are down in San Francisco, but it may be due more to the type of homes hitting the market than weak demand.
Inventory Shifts Drive Pricing Adjustments
There’s been a marked shift in the housing inventory in the metro area, Krimmel adds.
“It’s not about San Francisco homes losing value, but rather how expensive the available inventory is this year relative to last,” he says. “There are fewer small, pricey homes in the center of the city for sale. They are scarce and selling fast. On the flip side, this year there are relatively more large, less expensive per-square-foot homes coming up for sale in outer suburbs,” he says.
Silver Lining for Buyers
Real estate experts note that these downward adjustments offer a welcome silver lining for prospective buyers who have felt sidelined by affordability constraints over the past few years. As active inventory continues to build nationally—climbing toward levels not seen since late 2019—sellers in these cooling markets are increasingly forced to reevaluate their pricing strategies to attract a more selective pool of financially qualified buyers. Whether these double-digit or near-double-digit pullbacks represent a temporary normalization or the beginning of a broader regional shift will depend heavily on local economic momentum and upcoming changes in mortgage rates as the autumn buying season approaches.