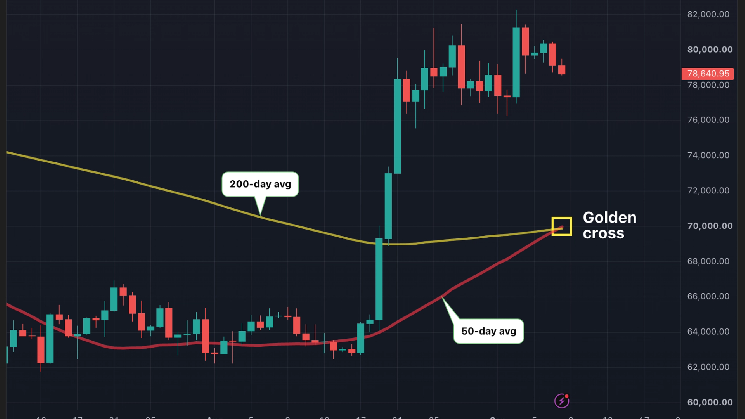
The wait for Bitcoin bulls has ended as the flagship cryptocurrency has confirmed a widely watched golden cross on its price chart. The bullish signal activated while Bitcoin traded near $78,565, though historical data suggests the indicator carries a mixed track record as a standalone predictor of sustained rallies.
What the Golden Cross Signals
A golden cross forms when an asset’s 50-day simple moving average (SMA) crosses above its 200-day SMA. The crossover indicates that short-term momentum is overtaking the long-term trend, potentially setting the stage for an extended advance. Bitcoin’s latest golden cross went live at the $78,564.82 level.
Historical Performance Is Mixed
CoinDesk research reviewed the indicator’s history and found the signal has triggered 12 times since Bitcoin’s inception. The long-term results are uneven:
- Only three of the 12 historical crosses remained valid for a full year, delivering an average return of 250% over those 12-month periods.
- Across the remaining nine measurable instances where three-month data was available, the signal produced a far more modest average gain of 24.9% over three months.
The data implies the golden cross has produced premature bull traps three times as often as it has sustained multi-year rallies, meaning the latest signal is far from a guarantee of long-term bullishness.
Current Market Context
As of publication, Bitcoin changed hands at approximately $78,650, down 0.6% since midnight UTC, according to CoinDesk data.